Fantasy Projections User Guide
Please scroll down for an in-depth overview of the Fantasy Projection tools we offer on the site.
Step 1: Select your league setting from the “Scoring” dropdown (Points League or Categories League)
Step 2: Select the metrics your league uses from the “Categories” dropdown
- Note: if you select or de-select any metric all weights will be reset
Step 3: Update the weights using the user input boxes provided
Step 4: Hit Submit to display the player ratings
Fantasy Page Definitions:
| Metric | Definition |
|---|---|
| FPV | Fantasy Points Value (total of all metrics multiplied by the user selected weights) |
| FPV Adj | Fantasy Points Value Adjusted (adjusted per position – F, D, and G) |
| FPV-z | Fantasy Points Value Z-Score (used for category leagues – all metrics are converted to z-score and summed) |
| FPV-z Adj | Fantasy Points Value Z-Score Adjusted (used for category leagues – all metrics are converted to z-score, summed, and adjusted per position) |
| Pos Rank | Positional Rank |
Notes:
- ATOI, SV%, and GAA are given a base weight of 1. If you are in a points league, please note that the default weights are intended for category leagues. Adjust accordingly.
- When a metric is removed from the Category dropdown, the user input box will be removed and the weight will become 0. If that metric is selected again, the user input box will be displayed and the weight will be set to the default
Our preseason projections are available for the current season (under the “Projections” tab, select “Preseason” from the “Type” dropdown). In addition we have tools to view current totals, rest of season projections, end of season projections, and an over / under performing values for all skaters and goalies. The following is an overview of what’s going on with these pages, how they work, and how you can use them!
Current Totals, Rest of Season, and End of Season Projections
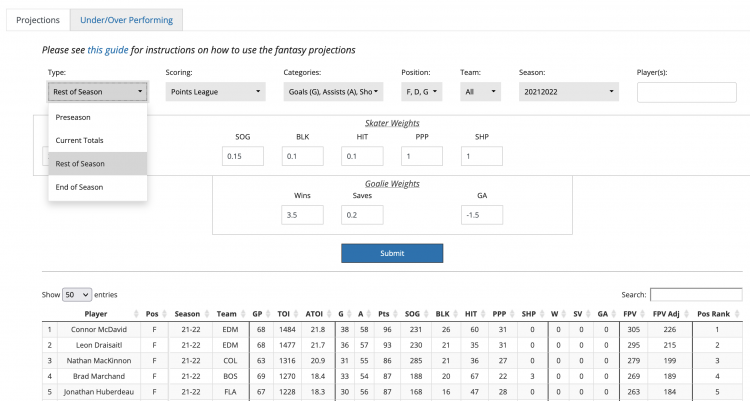
Under the “Projections” tab in the “Type” dropdown, you’ll see our original preseason projections along with options to view current totals, along with projections for the rest of season and end of season. The Current Totals tables is a convenient place to see how players are performing so far. The rest of season and end of season projections require a bit more explanation. Upfront we should say that these features do not use a new model (for instance one that predicts specifically for in-season metrics) – the process is a series of calculations accounting for playing time (both played and remaining) and preseason projection rates. This process is something that others could do on their own with their own projections if they felt so inclined.
Current totals: this table shows all user-selected metrics, user-input weights, and the overall value every player has added through the prior day (the FPV / FPV Adjusted metrics and ranks are the same as well). There isn’t anything special happening here: we’ve provided this as a reference for what you will likely see on your respective fantasy site for simple comparison(s) with the other pages.
Rest of season: we take the projected per-game-played rates for all metrics for all players, determine how many games we expect each player to play in the remainder of the season, and multiply them. For example: Player A’s team has played 24 games, however Player A has only played in 15 of these games. For the entire season, we projected Player A to score 20 goals in 70 games. So:
Rest of Season Goals: (20 / 70) * ((70 / 82) * (82 – 24)) = 14.1
I’ve added additional parentheses in this to differentiate the “sides” of this calculation. The left side (20 / 70) is the per-game goal scoring rate we projected for Player A, and the right side ((70 / 82) * (82 – 24)) is our projected rest-of-season games played total. The right side here takes the ratio of the total games we projected Played A to play in a full season (85.4%) and multiplies this by the remaining available games for Player A’s team (58 total games since Player A’s team has already played 24 games), which gives us just under 50 games that we expect Player A to play over the remainder of the season. In essence we’re just applying our projections to a smaller sample than the 82 games in a full season.
End of season: with the rest of season metrics calculated for all metrics, we can then add the rest of season numbers to the actual numbers for all metrics to arrive at end of season numbers. So, say in their 15 games played, Player A scored at a pace below their full season projection. Let’s say they have 2 goals in the 15 games they’ve played as an example, their end of season projected goal total would be 16.1 (2 + 14.1), which is about 4 goals below what we projected heading into the full season. Most things in these calculations are fixed, only the games played for a player’s team changes the final number.
Under/Over Performing Tools
With this tool, we’ve attempted to provide a view of how players are performing in-season compared to their preseason projections. I’ll go into more detail below, but the numbers displayed here are all “differences” – positive numbers indicate performance above expectation and negative numbers indicate performance below expectation. The conditional formatting for color shows the degree a player is over-performing (blue) or under-performing (red). Let’s discuss how these are calculated.
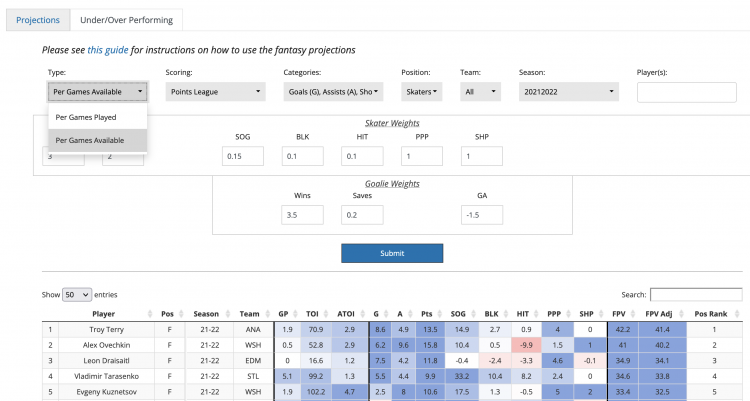
There are several ways to calculate these differences, each of which can provide a different view of how players are performing relative to preseason expectations. We arrived at two that we feel are the best. Once again under the “Type” dropdown, “Per Games Played” and “Per Games Available” are the options.
Per Games Played: this calculation looks strictly at how a player has performed in the games they’ve played. In a way it can be thought of as a playing time or injury ignored view. The calculation is the difference between what a player has done so far at a given point in the season minus what we would expect through the number of games that player has played in. Let’s take Player A again. They’ve scored 2 goals in the 15 games they’ve played in. Based on our preseason projections, we expected Player A to score 20 goals in 70 games. Through 15 games, we would expect Player A to score about 4 goals (4.3 to be precise) based on their projected rate, which gives us an “under performance” of 2.3 goals for Player A (2 – 4.3). The calculation:
Per Games Played Goal Difference: 2 – ((20 / 70) * 15) = –2.3
Per Games Available: here, we’re incorporating team games into the calculation. Instead of looking strictly at the games a player has played so far for the difference comparison, we’re taking the games we expected them to play in as our figure. All the above is the same, but we switch out the games Player A has played (15) for the number of games we expected them to play. It looks like this:
Per Games Available Goal Difference: 2 – ((20 / 70) * ((70 / 82) * 24)) = –3.9
The “right” side takes the projected rate for Player A multiplied by the expected games played rate for a player – in this case, their team has played 24 games, and we would expect them to play 20.5 of those games. Player A has played less games than we expected and has also scored less goals than expected when compared to the per games played view.
So which one is better? We’ve defaulted to the second option here as we feel it’s a bit more reflective of where fantasy owners likely expected their draft picks to perform. The per games available method accounts for missed time in addition to performance. For example, Nikita Kucherov’s goal performance is -0.6 using the per games played method but -6.5 using the per games available method (through 2021-11-17 in the ’21-22 season, about 1/5th of the current season give or take). However, the per games played method can be useful to look at uninjured players who are performing well / poorly, or for those who just want a view of raw actual performance in actual games played. We’ve made both available so users have a choice.
Goalies
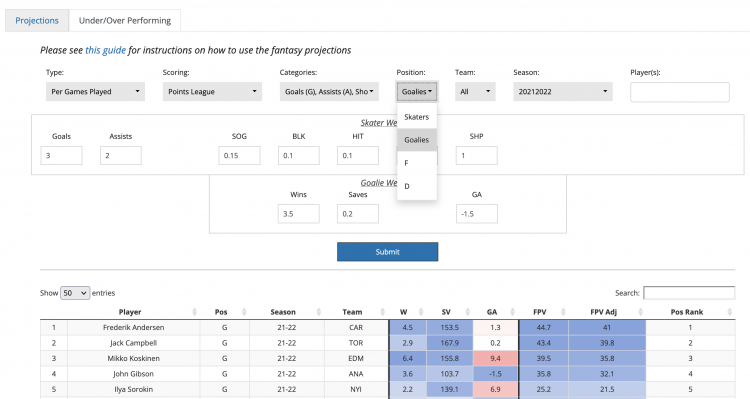
Under the “Position” dropdown, we’ve offered filtering options for various position groups. For goalies, we’ve decided to offer only the “per games available” view. After testing both, the per games played method for goalies is generally less desirable and results in misleading outcomes (I’ll just leave it at that – things get weird). Goalies inherently play far fewer games than skaters do, and differentiating between goalies missing time to injury vs. not playing because their usage has changed slightly is more ambiguous. Additionally, especially in small samples, a few of the goalie metrics (namely Save % and GAA) can skew wildly, so please keep this in mind if something looks a little weird.
Conclusion
The “FPV” / “FPV Adj” (points leagues) and “FPV-z” / “FPV-z Adj” (categories leagues) values are the same as they were for the preseason projections. The selected metrics and weights (for points leagues) are multiplied in the same manner – please reference the top of this Glossary post for the exact definitions. For the “Over/Under Performing” tools, these numbers can be directly interpreted as the overall value added above/below expectations at a given point in the season based on the user-defined metrics and weights.
As always, please let us know if you have any questions, see any issues, or would like to chat about how these work in any way we haven’t covered here. Please utilize either the Contact Us form under your profile dropdown or email us at support@evolving-hockey.com.