Regularized Adjusted Plus-Minus
Introduction
Regularized Adjusted Plus-Minus (RAPM) is a method for evaluating skater performance that seeks to improve on the known issues with on-ice metrics (such as raw on-ice Corsi For %, etc.). Raw on-ice skater ratings are inherently impacted by the teammates a player plays with, the opponents they play against, a player’s percentage of zone starts in the offensive or defensive zone, back to back games, etc. There are many aspects of the game that players have no control over. The goal of RAPM is to control for these aspects and provide a better measure of a player’s offensive or defensive ability.
RAPM seeks to account for all these factors by using a statistical technique called linear regression (specifically, a regularized linear regression called ridge regression). This allows us to control for all teammates, opponents, score state, zone starts, etc. at the same time further increasing the accuracy of a specific player’s rating. The method can be used at various strength states and for various metrics. On Evolving-Hockey, we provide 2 strength states (EV & PP/SH) with 3 separate metrics (Goals, Expected Goals, and Corsi). Each regression is run for each season and players are separated by team (traded players are split into multiple versions of themselves – one version for each team they played for in each season).
The name “Regularized Adjusted Plus-Minus” is taken from basketball statistics where this method was originally developed (see our References Page for links to the foundational works of RAPM in basketball and hockey). Our full RAPM model writeup can be found here.
Model Overview
- The RAPM models on Evolving-Hockey are stint-level weighted ridge regressions. The target variables are per 60 rates (separate regressions are run using GF/60, CF/60, and xGF/60 as the target variables), the weights are the length of each stint (stint is defined as a period of play where no player substitutions occur), and the predictor variables are:
| Variable | Definition |
|---|---|
| All Skaters – Offense | true/false variable: 1 = skater was on the ice for the stint, 0 = skater was not on the ice for the stint |
| All Skaters – Defense | true/false variable: 1 = skater was on the ice for the stint, 0 = skater was not on the ice for the stint |
| All Goalies – Defense | true/false variable: 1 = goalie was on the ice for the stint, 0 = goalie was not on the ice for the stint |
| Score State | 7-level factor variable for CF (home lead of -3 through +3), and 3-level factor variable for GF and xGF (trailing, tied, leading) |
| Strength State | 3-level factor variable equal to the applicable strength states in the regression (EV is 5v5, 4v4, and 3v3. PP/SH is 5v4, 5v3, and 4v3) |
| Offensive “Zone Start” | true/false variable: 1 = stint included at least one faceoff in the offensive team’s offensive zone, 0 = no faceoff in offensive zone |
| Neutral “Zone Start” | true/false variable: 1 = stint included at least one faceoff in the offensive team’s neutral zone, 0 = no faceoff in neutral zone |
| Defensive “Zone Start” | true/false variable: 1 = stint included at least one faceoff in the offensive team’s defensive zone, 0 = no faceoff in defensive zone |
| Back-to-Back | true/false variable: 1 = offensive team had one night of rest, 0 = offensive team had more than one night of rest |
Notes:
- The skater ratings are the coefficients that result from the regression. These are interpreted as a skater’s offensive and defensive contribution (per 60 minutes) to the league scoring rate (Goals, xG, or Corsi).
- Goalies are only included in the GF/60 RAPM regression.
- To combine ratings across multiple seasons, the RAPM ratings are divided by 60, expanded out by a player’s time on ice, summed, and then converted back to per 60 ratings. For example, the calculation to combine Patrice Bergeron’s 13-14 and 14-15 seasons looks like this:
- (11.12 / 60) * 1090.07 = 202.03
- (13.41 / 60) * 1105.25 = 247.02
- (202.03 + 247.02) / (1090.07 + 1105.25) * 60 = 12.27
RAPM Charts
The RAPM Charts use the RAPM metrics we feel are most reliable for skater evaluation. These include:
- Offense:
- Goals For per 60
- xG For per 60
- Corsi For per 60
- Defense:
- xG Against per 60
- Corsi Against per 60
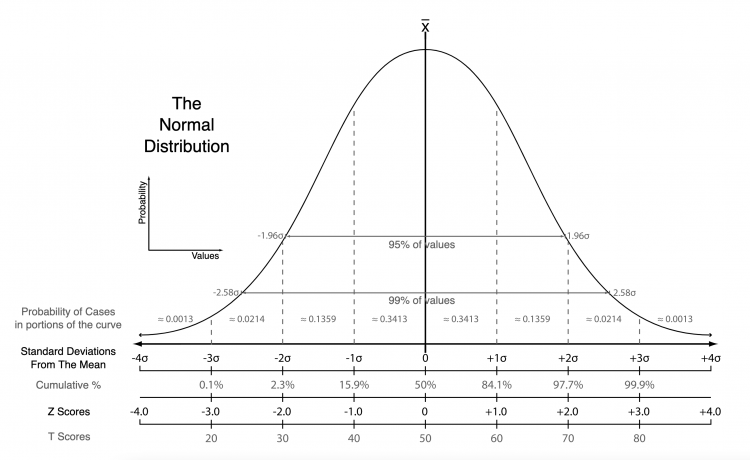
The respective RAPM ratings used in the RAPM Charts are centered and scaled around the positional mean (Forwards/Defensemen) of the selected timeframe using Z-Scores. This is done so each RAPM rating can be viewed on the same “level” as the others. Using Z-Scores we can look at how a player has performed relative to all other players at the same position over the selected timeframe.
Note: The GA/60 ratings that result from the Goals RAPM regressions are inherently influenced by the goaltender behind the skater and are problematic for defensive evaluation. They are not included in these charts for this reason.