
Disclaimer: the data in this article was last updated June 29, 2024. Any contracts signed between then and publication of this article will not be reflected below.
It’s that time of year, once again. NHL free agency begins tomorrow, and we here at Evolving Hockey are back to preview the summer market in the only way we know how: smushing some of our models together and looking at the results. We released our Contract Projections for the 2024 NHL offseason in mid-May, and our GAR projections for the 2024-2025 NHL season were updated a little over a week ago. These are the two models we’ll be, as noted, smushing together. That’s a technical term, of course.
Since I’m using the same process that I used in the summer of ’22 and ’23 (very little with the actual process has changed here), I’ve decided to omit the full explanation in order to avoid either unnecessarily copy-and-pasting myself or just saying the same stuff again. For those who are new or just want a refresher, please reference the 2022 and 2023 previews (linked below) for the full explanation of our Cost Per Win evaluation and methodology.
References:
Cost Per Win Discussion

As with the prior two seasons where we’ve looked at this distribution (and essentially every season, to be frank), we see a similar thing: these numbers mirror the distribution of GAR within a given season since we are essentially just converting GAR values to a new number without adjusting the scale. Remember, “GAR Value” is just a player’s total GAR in a season multiplied by the corresponding Cost Per Goal value for the respective season.
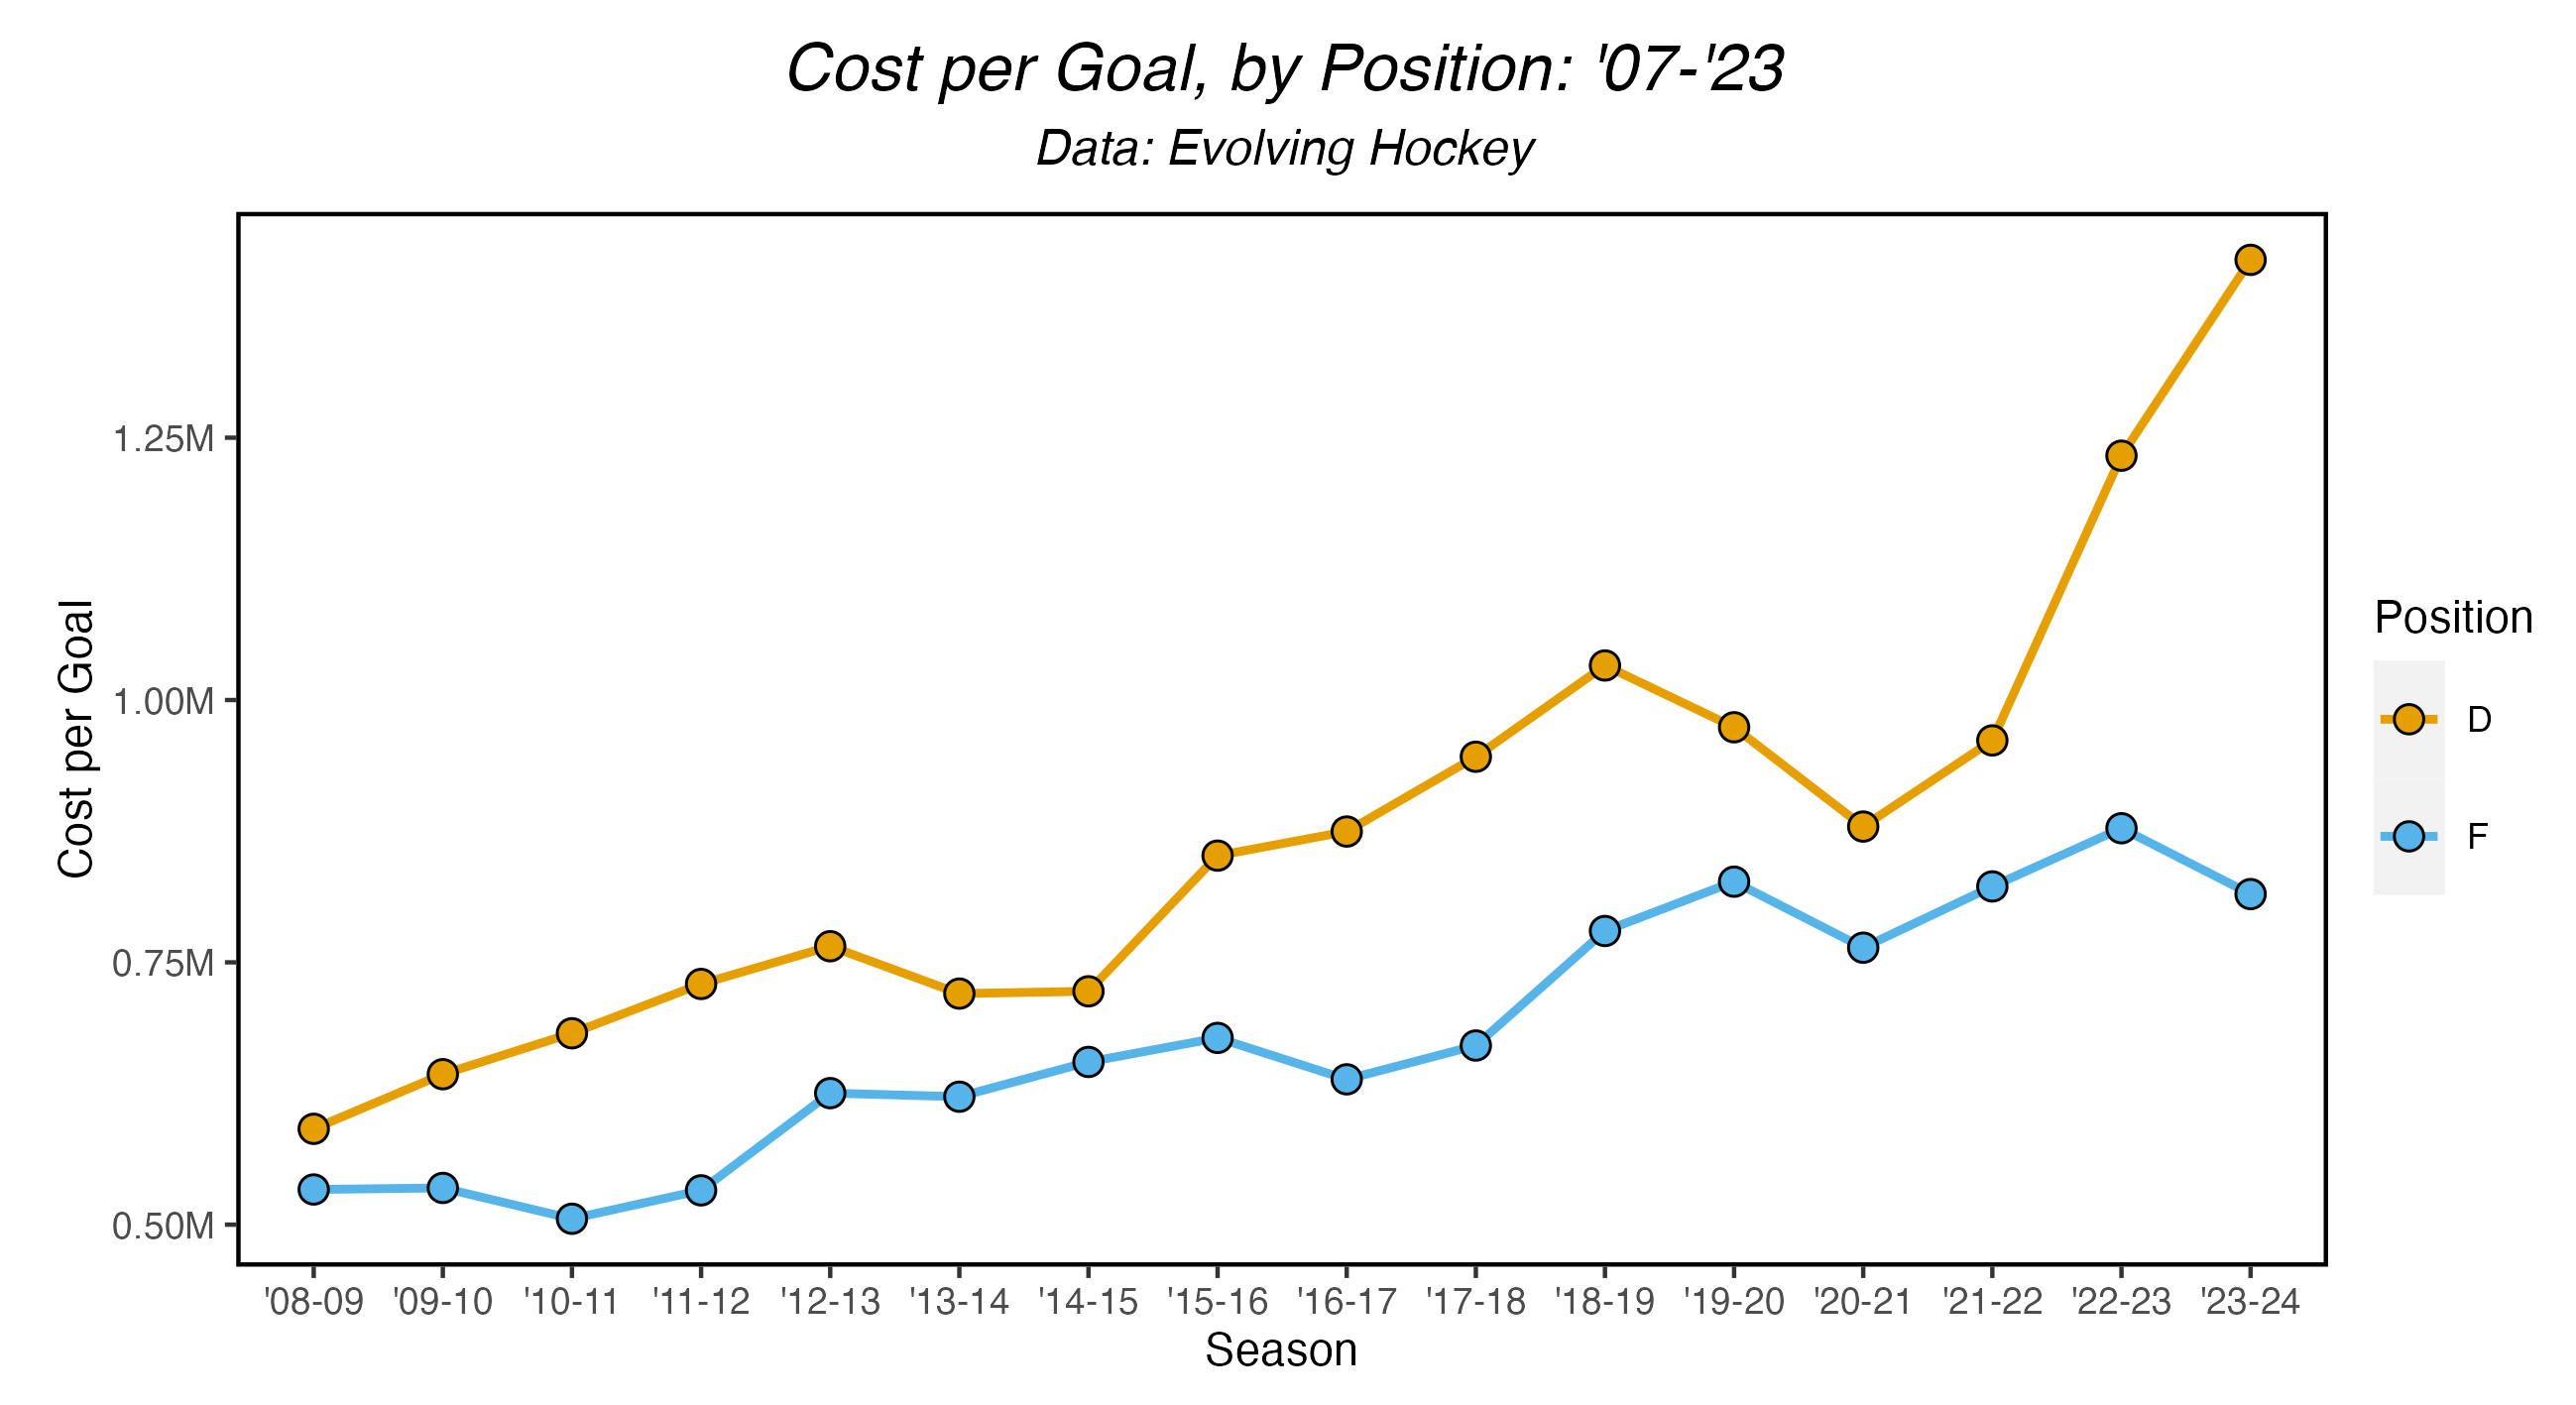
Here, however, we get into the same interesting trend that I noted last year: buying goals from defensemen has gotten really expensive. The same reasons apply as they did last year. One of those reasons (the salary cap’s continued increase) still tracks, but the bigger reason for this increase is recent contracts given out to defensemen. In the last three seasons, we’ve seen bigger contracts handed out to defensemen with worse results than we’ve ever seen before. Interestingly, this isn’t entirely due to the bad defensemen. Over the last 2-3 seasons, we’ve also seen the overall distribution for defensemen performance/value from a GAR viewpoint shift lower while contract values stay relatively stagnant.
There are a few ways to state this, but in general, teams have paid the same amount for defensemen who are providing worse results, overall. Because of this, it costs more to buy goals from defensemen than it ever has (or at least since 2007). Now, if we imagine a trend line that tracks the Cost Per Goal value for defenseman through the years, we might be able to envision a line that actually kind of follows the overall increase here, which is interesting to note. Like last season, this requires another article to fully explore (I will do this this summer, I promise).
With that said, I think it’s important to discuss the use of GAR for evaluation in our discussion of Cost Per Win. Our current methodology relies on our Goals Above Replacement model, which can be a little questionable when evaluating defensemen, at least in smaller samples. GAR uses, in various ways, on-ice Goals For as a measure of offense. Given that, we generally prefer to use our xGAR model in smaller samples. However, we’re using a weighted-average of prior three years for all players, which does give us a larger sample to rely on. Even still, we felt it necessary to dig a little further and swap GAR and xGAR for the Cost Per Goal analysis for the sake of comparison. Surprisingly, the difference was only ~$50k less for defensemen (and was actually a bit more costly for the ’21-22 season). Despite the potential shortcomings of GAR when evaluating defensemen, the high correlation between both models perseveres in this evaluation as well.
So to summarize: since the ’20-21 season, teams are paying more for defenseman for worse results overall. Because of this, it now costs more to buy a theoretical goal (in WAR-terms) than it has historically. In a way, one could argue this opens even more avenues for smart teams to find value in available free agents. But again, we need another article to explore this.
Player Evaluation
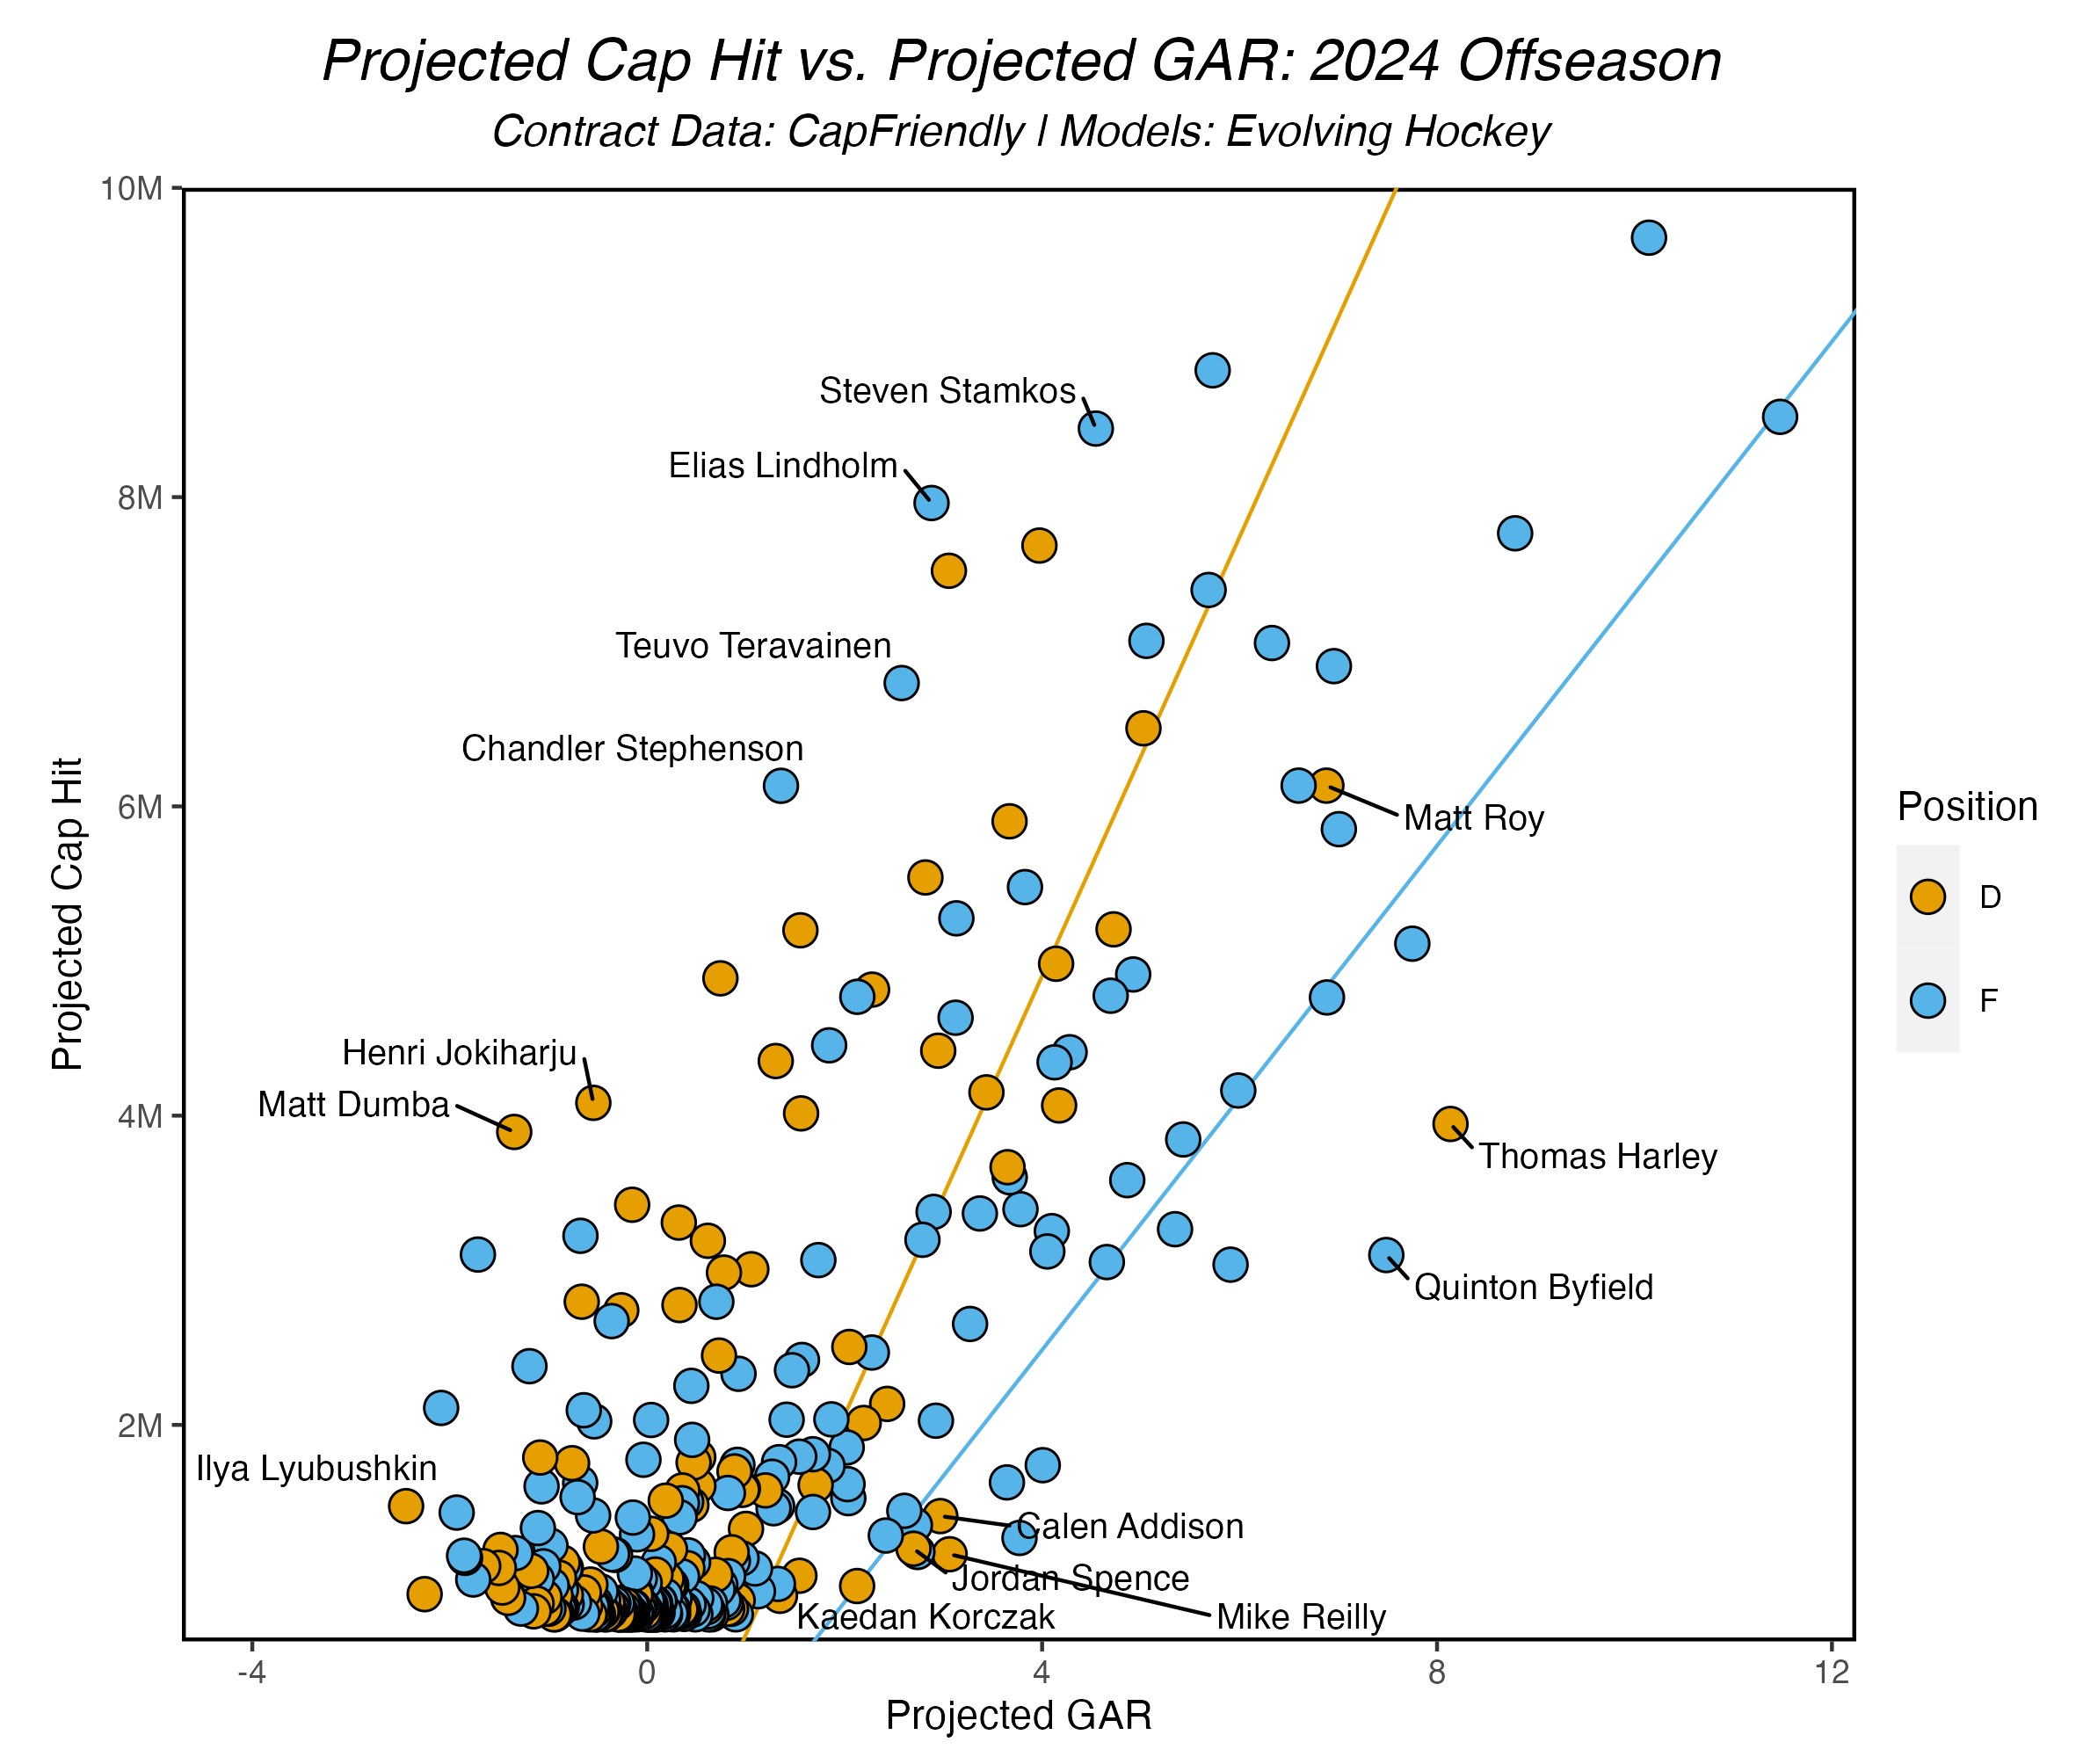
Each line above represents the respective cost per goal values for each position. Players that fall on the “right” side of the line here are potentially under-valued when comparing their projected contract to their projected on-ice performance value heading into next season, and vice versa. I’ve labeled a few outlier players that I’ll be covering below.
Having already discussed the shift in Cost Per Goal values in the last ~3 seasons, we can see this in practice above. The difference between Forwards and Defensemen is now even more pronounced than it was last year. There are a lot of things I could say here, but the somewhat obvious question is: should teams just start signing Forwards to slot into their 3rd pair? (insert Moneyball “it’s not that hard Scott” clip). In reality, there are actually about as many Defensemen “undervalued” relative to their positional Cost Per Goal as Forwards. The difference between positions may be widening, but available value is still about the same as it’s ever been.
Best Value: UFAs

This summer offers a completely different and more in-line-with-tradition group of available players. Last year we noted the lack of both high-value projected contracts (at the time >$7M per year, of which there was only one) and, in turn, players that teams might consider “stars”. This year, our contract model has 7 players projected over the $7M per year threshold (6 if we adjust for the increase in the salary cap… about that). Additionally, the salary cap has finally risen after years of speculation and rumors (from $83.5M to $88M), the largest since the summer of 2018. With that, we’re entering territory the model hasn’t “seen” since we’ve been maintaining it. With players like Sam Reinhart, Jake Guentzel, and Elias Lindholm available, things could get quite interesting depending on where the market goes.
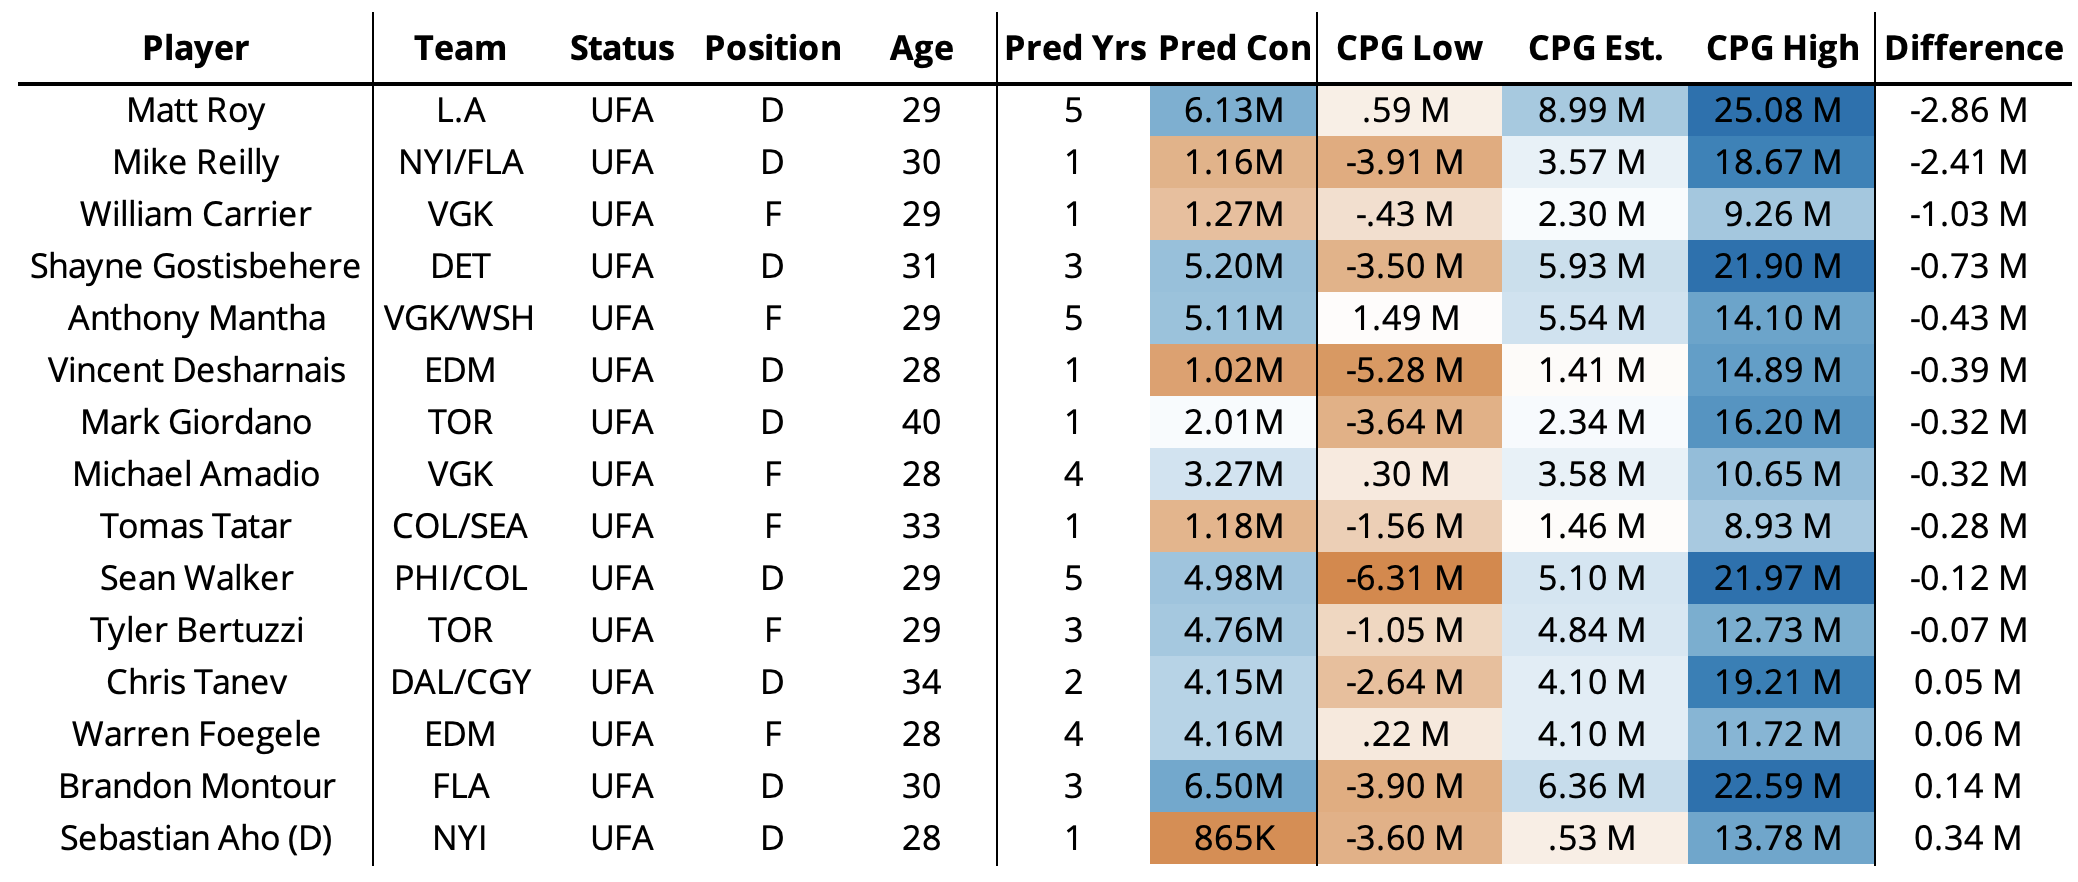
Our most “valuable” UFA this summer is Matt Roy, who will be testing the market per recent news. The 29-year old has been extremely consistent and quite good in every component in our GAR model(s) for the last two seasons with the Kings. Among defensemen in our GAR projections, Roy ranks 22nd heading into next season. His contract is among the highest projected for UFA defensemen (only Skjei and Montour have higher projections), but as far as our models are concerned, he’s the D-man with the most upside and potential value at 5 x $6.1M.

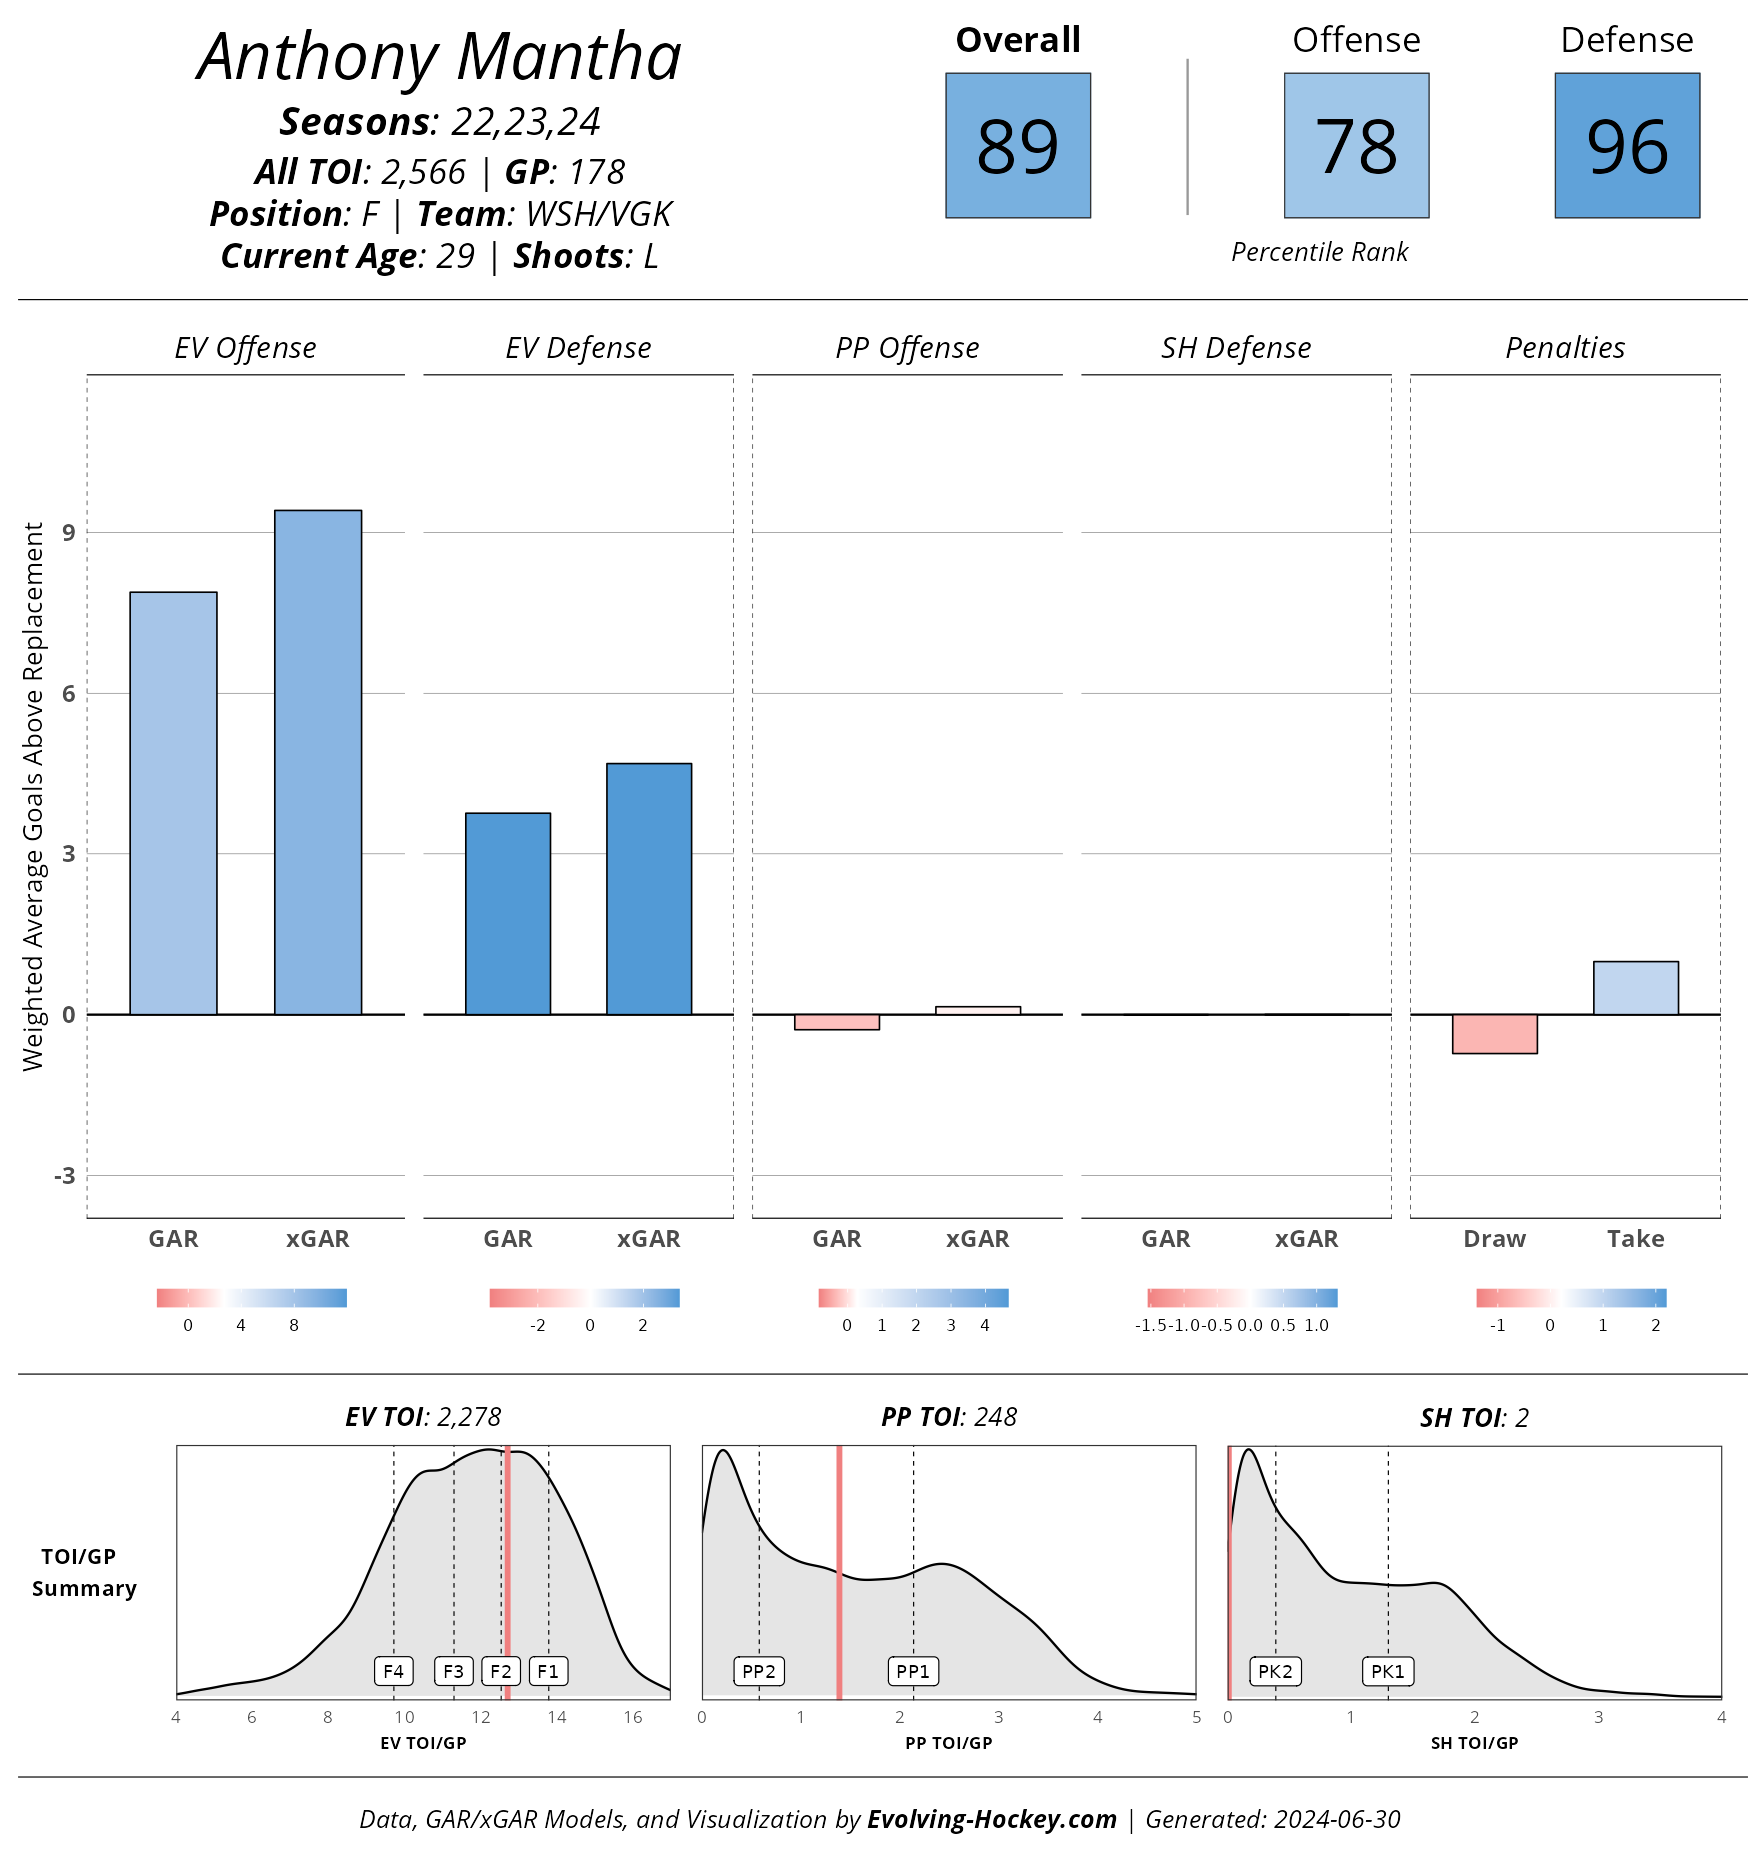
Once again, Anthony Mantha makes an Evolving Hockey list. Mantha had a fantastic season with both Washington and Las Vegas after the trade deadline. While he’ll turn 30 by the start of next season, Mantha grades out as an exceptionally consistent even-strength contributor with little downside. We’ve already discussed his value this year in our trade deadline preview and related podcasts, so it only makes sense he’d show up here. Even at a projected 5 x $5.1M deal, Mantha continues to be one of the most efficient and consistent players in the league compared to what the market values him at. The model is also somewhat divided on his most likely contract: his and 3 and 4 years at $3.7M-$4.6M are only slightly less likely than the 5-year contract we’re showing here. While the marquee names this summer will offer more from a box score standpoint, few UFAs will provide the kind of value that Mantha can deliver.
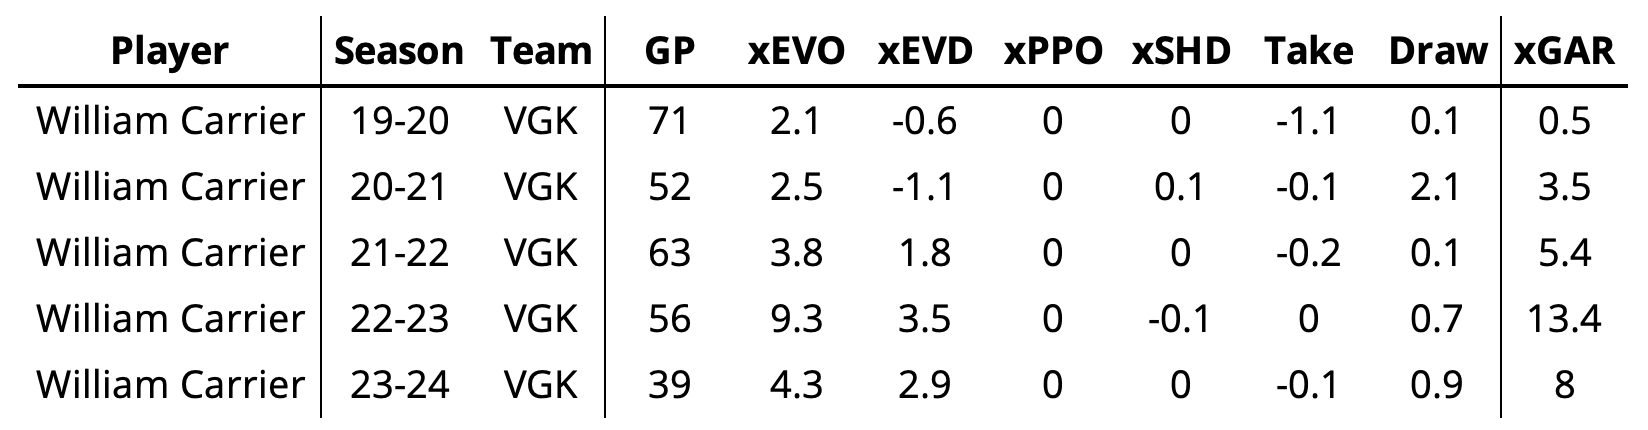
For teams looking for the best value bottom-6 depth forward on the market, Carrier is the guy. Having spent most of his time on the fourth line with the Golden Knights over the past few seasons, he’s been extremely useful as a shutdown forward while still generating surprisingly good offense at even-strength. Carrier isn’t a player teams will consider for a top-line role (although he did play 15 games with Phil Kessel in ’22-23 season, so maybe worth considering), but as far as depth forwards go, a 1-2 year deal in the $1.5M per-year range is going to be hard to beat. I don’t like praising Vegas at this point, but Carrier has been a surprisingly good under-the-radar depth player for them for years.
Best Value: RFAs


Just like every year, the RFA class carries a much better (and younger) crop of players for teams lucky enough to have them under control. Comparing the RFAs this summer to those a year ago, the high-end players per our contract model are a bit lower overall in terms of total $, but the available GAR in our projections is quite a bit higher. Is it finally the summer of offer sheets? Probably not, but we can always hope.
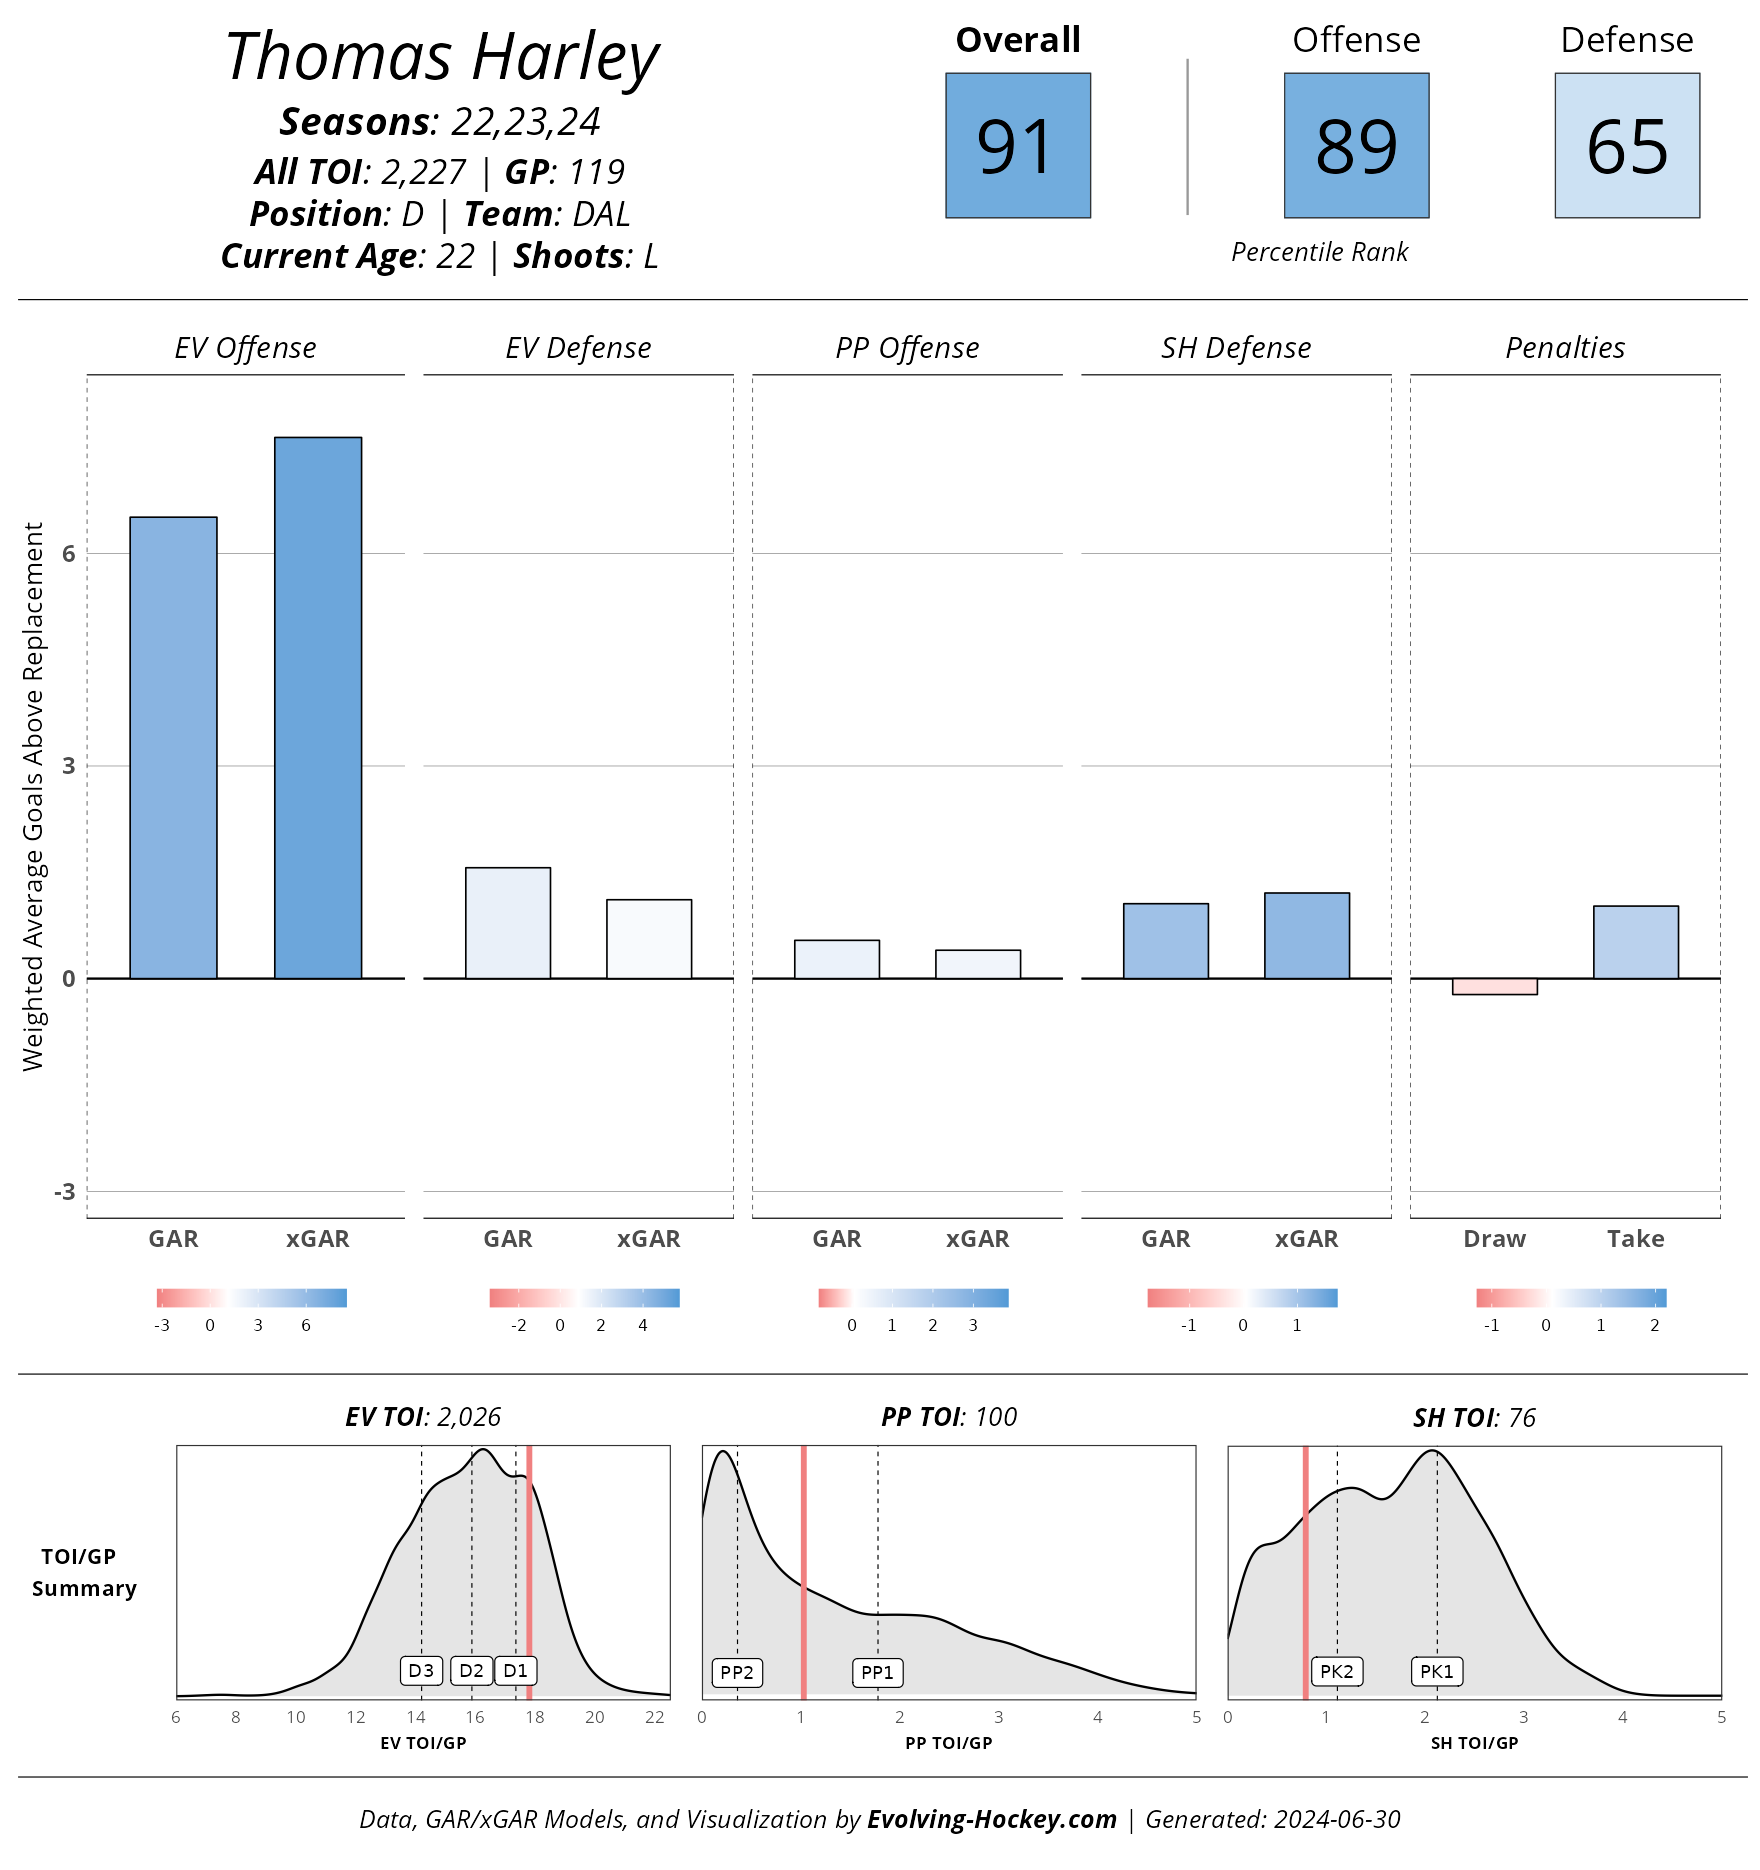
Thomas Harley had an absolute breakout year for the Stars this past season. Not only did the 22-year old put up the 5th most xGAR among defensemen in ’23-24, he’s ranks 13th in our GAR projections heading into next season. Now, a good deal of his value in this most recent season came from shooting, which is often quite variable and hard to replicate for defensemen in general, but his overall component-values were almost all above replacement at worst (he’ll work on drawing some more penalties I’m sure). His overall contract value here is inflated due to the model’s 24% probability for a 2-year bridge deal, but even at his next most likely 8 x $7.3M contract (23% probability), he’d still be the most valuable player among all free agents this summer. Why does Dallas just get to keep getting the good players?
Quinton Byfield is our kind of player. A 21-year-old all-defense skater who’s starting to figure out the offense? Sounds like an Evolving Hockey player already. In his first two seasons proper, Byfield (as a 19- and 20-year-old) struggled to transition to the NHL from an offensive standpoint but was consistently solid in virtually every other aspect our GAR model tracks. In the ’23-24 season, he found his game. If there’s one thing I can say about our GAR projection model that’s held true in actual performance relative to these projections, it’s this: early-20s players with solid defensive results are always going to be great. Like Harley, the model projects a 2-year bridge deal for Byfield, but the spread of possible terms is quite wide. Even still, he’d likely be a top-15 RFA at our projected 8 x $6.1M contract.

Now we move on to the Hurricanes, a team with 6 players in the top-25 projected contracts per our model (Guentzel, Necas, Jarvis, Skjei, Teravainen, and Pesce), which is quite something. Seth Jarvis grades out as the best value contract, even with the model’s hefty 8 x $8.5M projected deal. Ranking 21st among all skaters in our GAR projections for next season, he’s the real deal. At 22-years old, the young center put up the 2nd most points on the Canes last year while providing some exceptional defensive results to back that up. Some may point to Carolina’s system as a potential point of “over-performance” from a WAR perspective, and some may question how good his line with Martinook and Staal actually was given their low goal generation relative to expected, but it’s hard to deny that Jarvis brings an incredibly well-rounded skillset to Carolina. Unlike Nečas (see below), I doubt Carolina will pass on locking Jarvis up long term. Whether they can fit everyone else in this summer is maybe the bigger question.

Worst Value: All Contracts
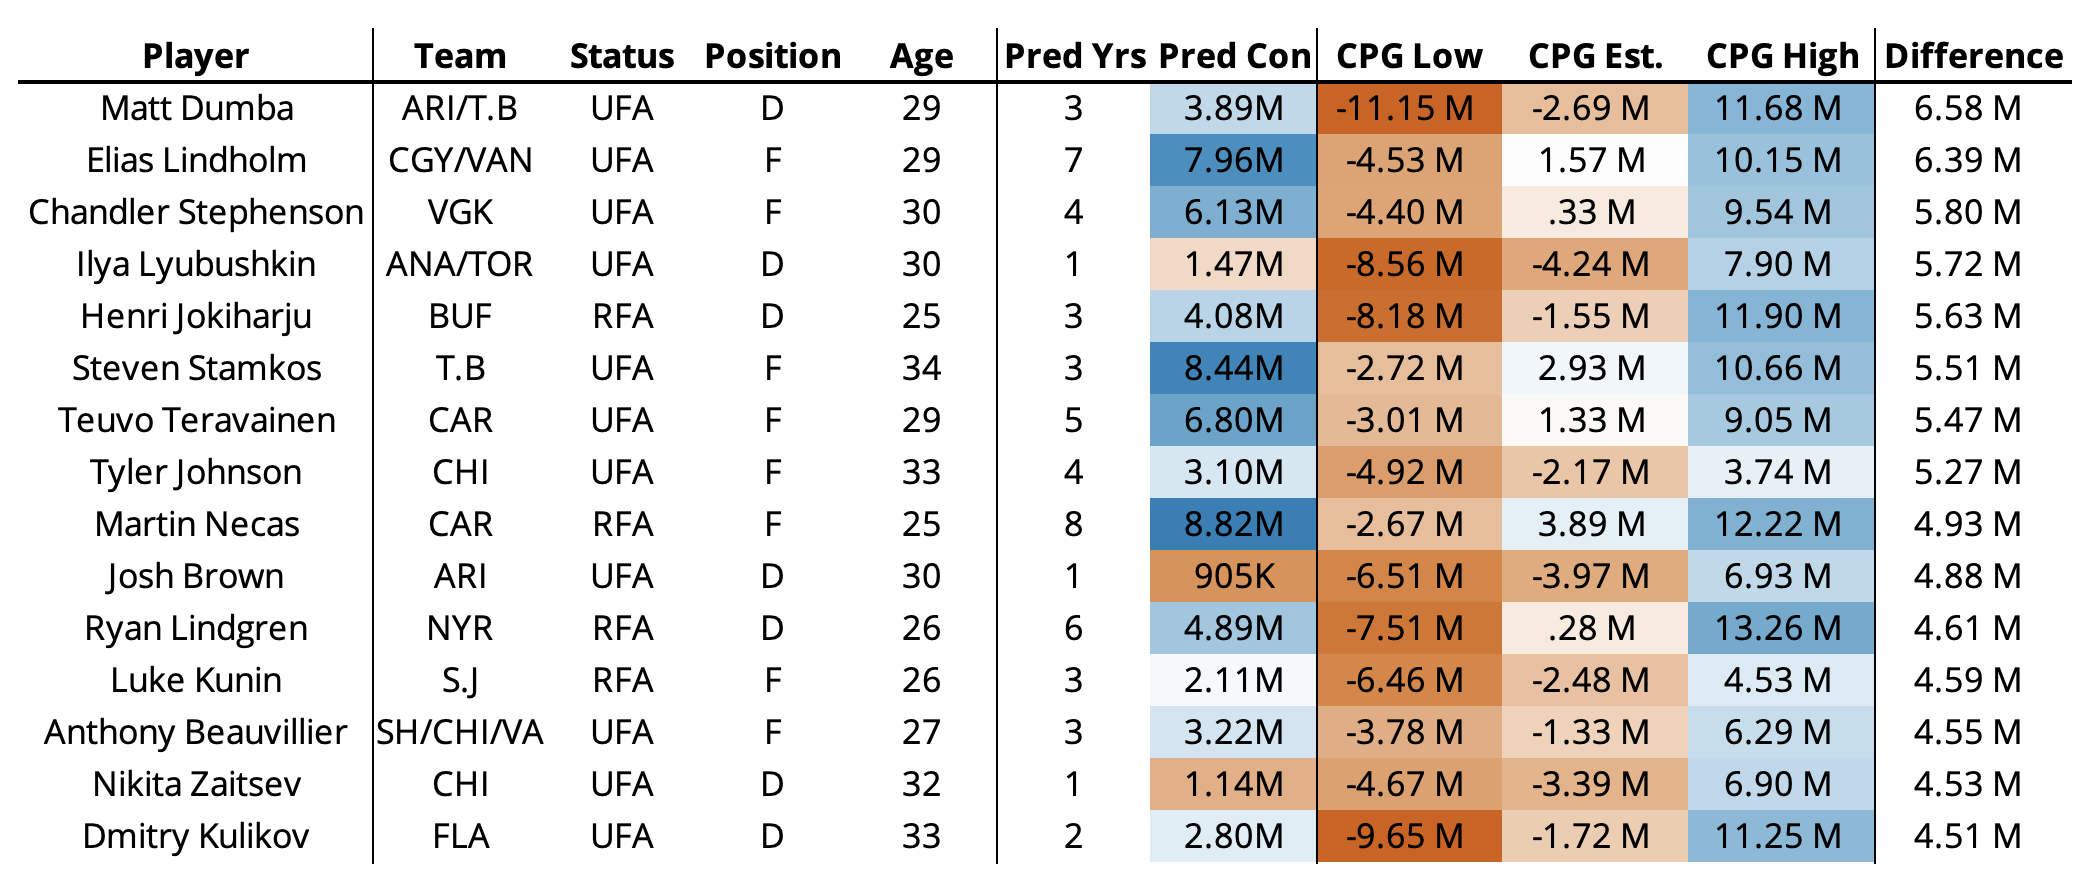
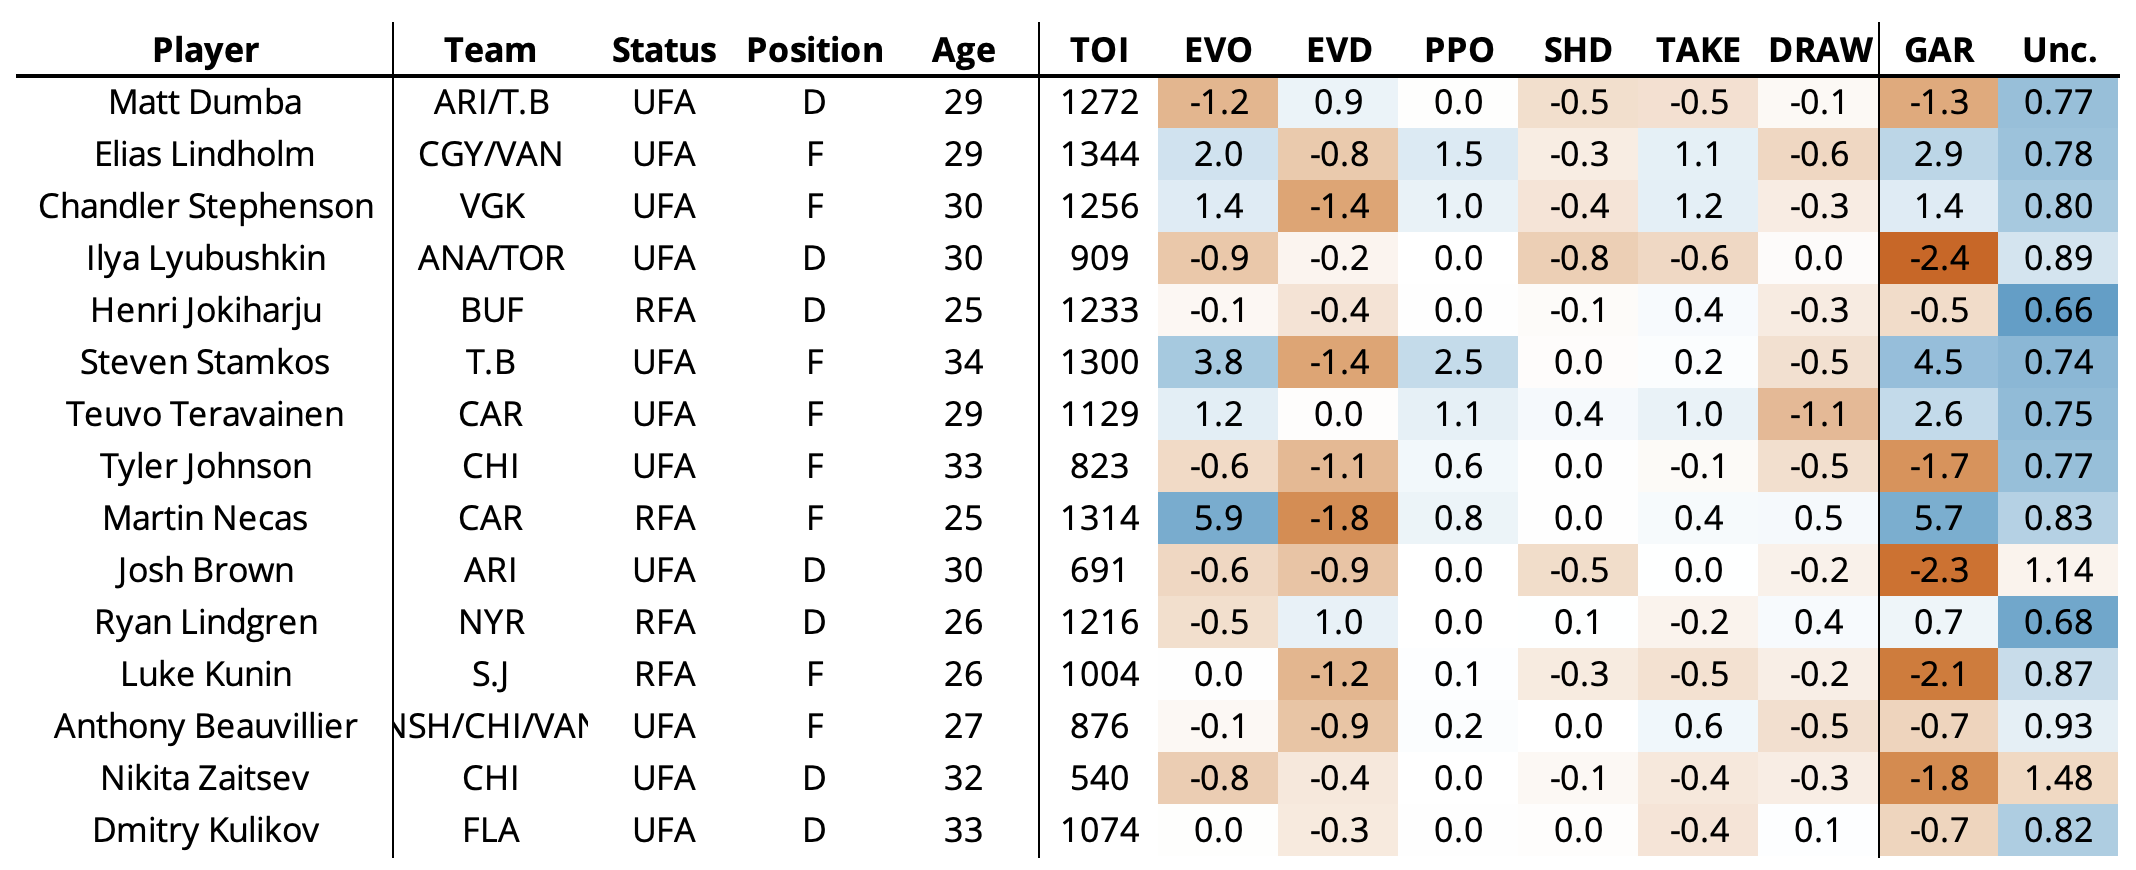
Just like years prior, it’s only fitting we show the potential worst contracts from this methodology’s view as well. Most of these names aren’t that surprising. A combination of aging defenseman and overvalued forwards, or some combination of those descriptors for the other position, round out a group of players most teams would likely be wise to stay away from (or rather try to bargain their market value down). Just like last year, the common trend for the these players is defense. Only Matt Dumba and Ryan Lindgren project to be above-replacement in EVD heading into next season, and most of these players have consistently provided below-replacement value on the other side of the ice.
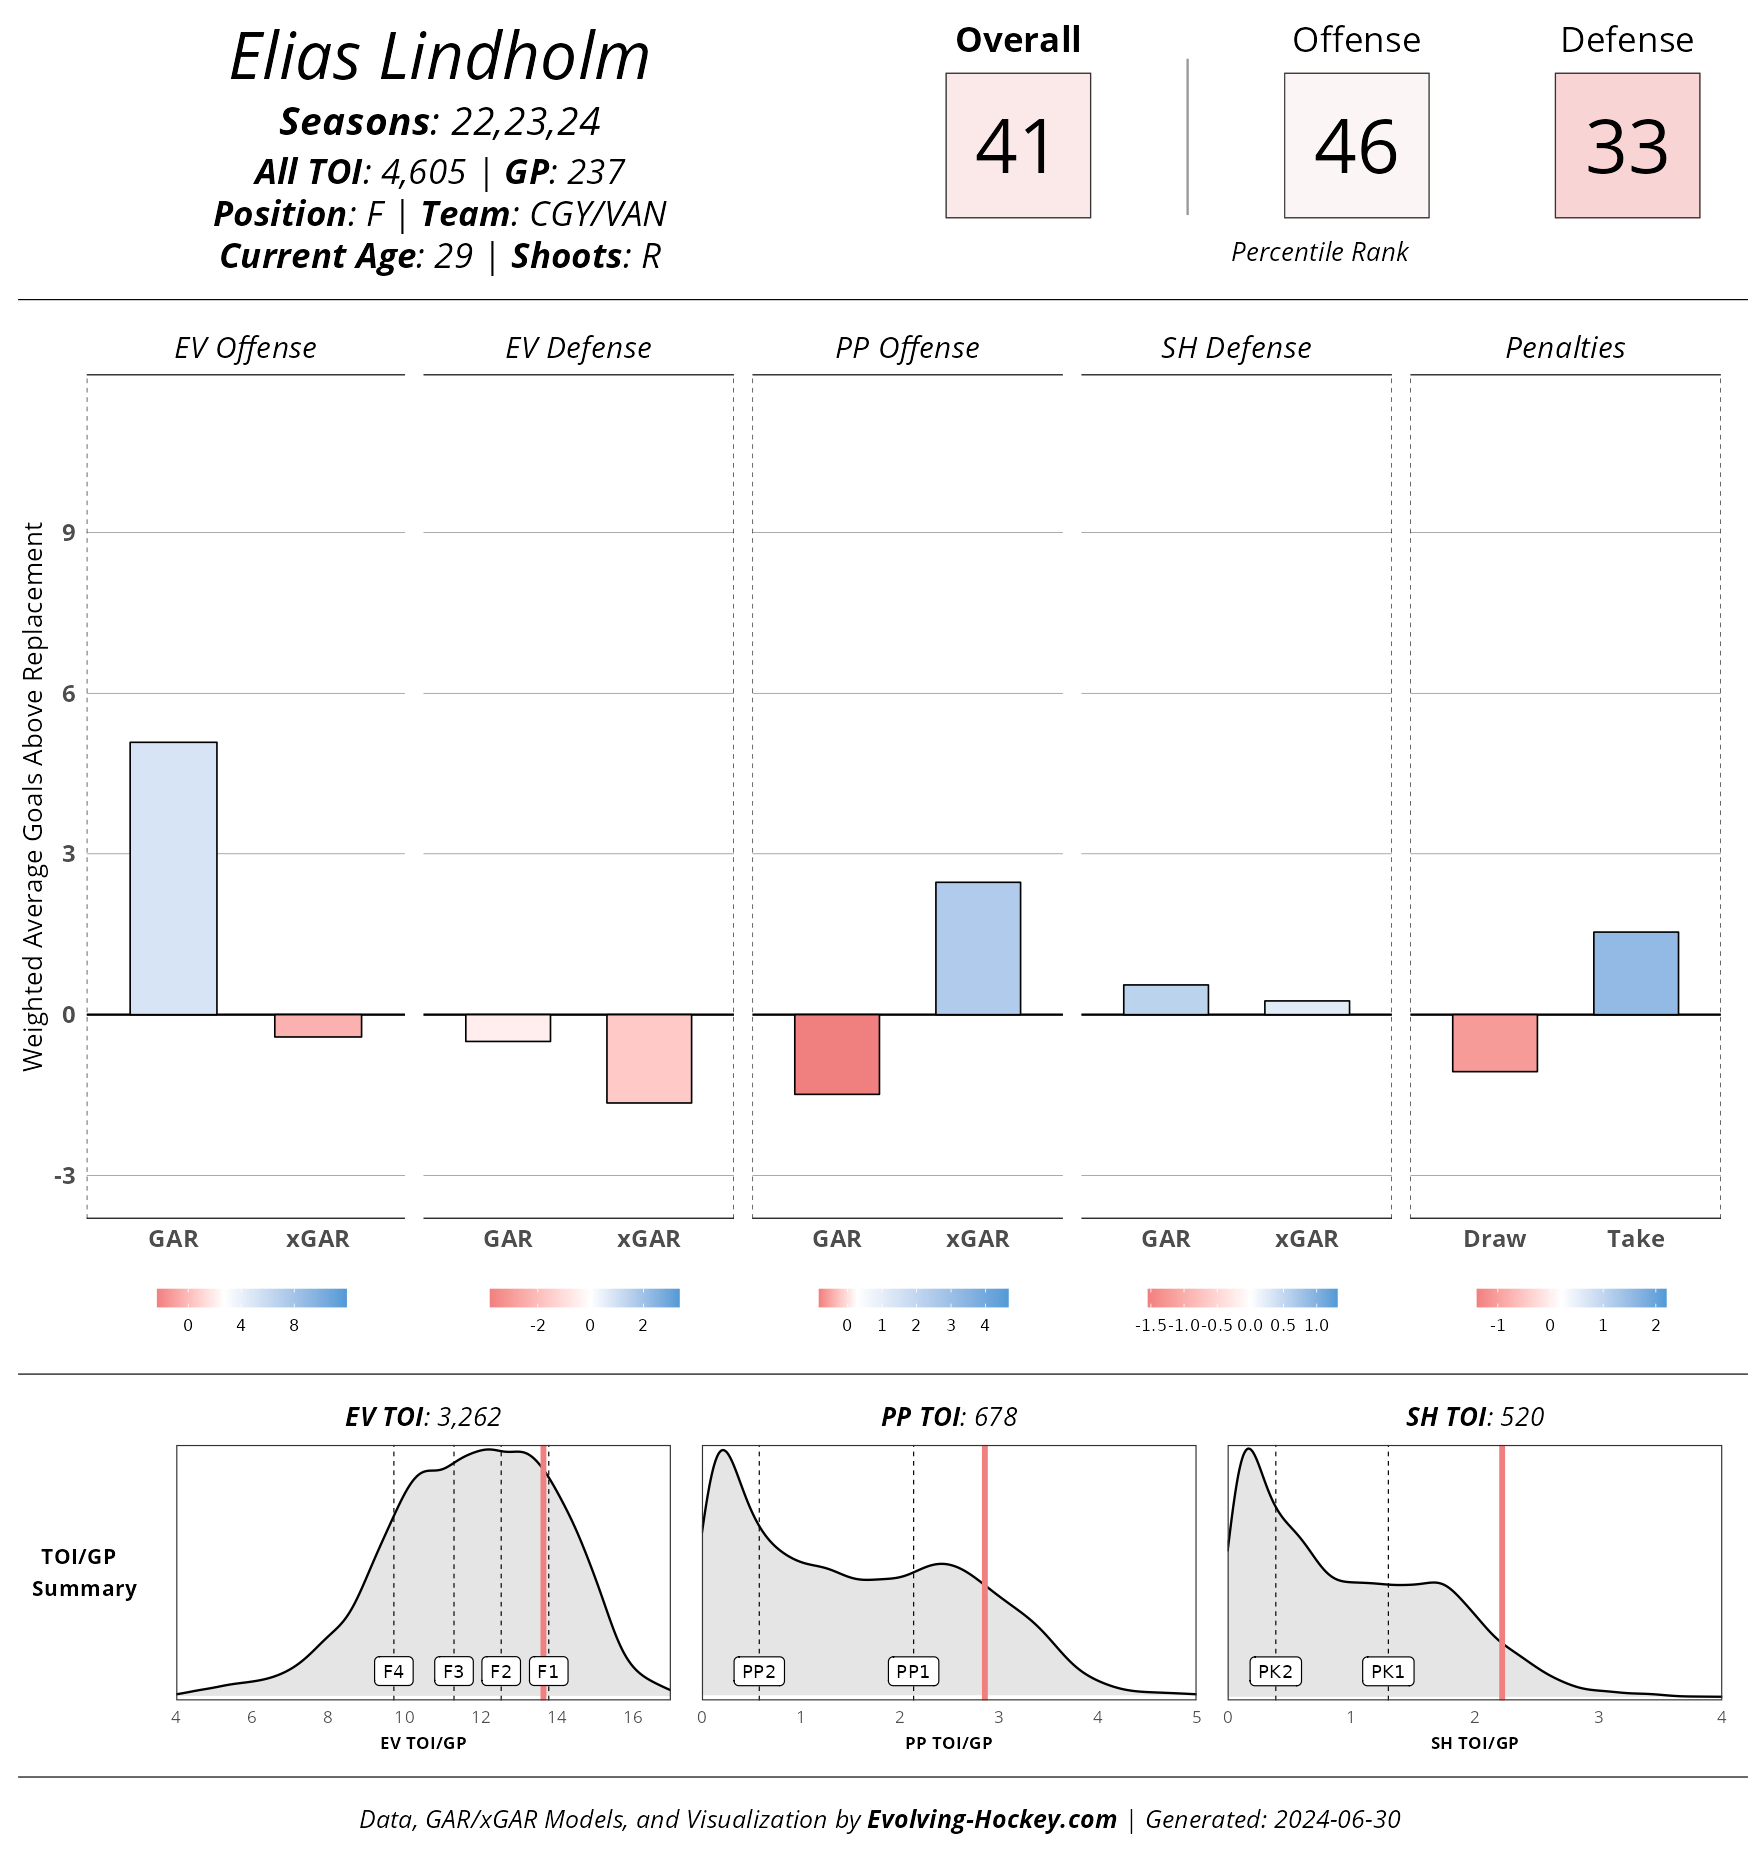
The biggest name here is Elias Lindholm. Ever since his ’21-22 campaign, with a nice duo of linemates for the Flames, Lindholm hasn’t been the same. He’s still contributing to the box score to an extent (although that’s even questionable now), but virtually every other metric we account for has shown a concerning decline. Given the narrative out of Vancouver and his fairly obvious slump, it wouldn’t surprise me if our contract model ends up being a bit high on him when everything is said and done. That said, it’s completely possible that the right fit exists on a team looking for a player with the obvious ceiling Lindholm has shown.
Wrapping Up
Unlike last summer, there will be some big fireworks in the coming weeks. While market expectations will change, the Salary Cap may increase by another $10 million in ’25-26, and we might get another two teams in the league at some point, the available value isn’t all that different from year’s past. There are still “market inefficiencies” left to pursue. We’ve chosen one way to attempt an evaluation of these potential inefficiencies, but there are countless ways others may choose to look for them. Teams may have their own entirely different method, which may lead to some interesting discrepancies in our August Free Agency Review. Regardless, we just hope your favorite team signs the best players, gets the best value out of those contracts, and wins the President’s Trophy next season. Let’s have some fun, eh?