Here we are. Down to the final two – both of which were entirely expected. Two juggernauts about to go to battle as they say.
Ok, well, at least Tampa Bay isn’t that surprising. The Montreal Canadiens shocked even non-hockey fans with their victory over the Vegas Golden Knights. Despite Vegas entering the playoffs as the third strongest team among playoff contenders per our model, having made it to the Conference/Semi finals for the third time in their four year history, the Knights once again find themselves knocked out of the playoffs by an underdog (ignore ’17-18). The Islanders continued to trouble the public modelers and rally the non-believers with a very close-to-happening upset over the Lightning. Taking the series all the way to the final game, it seemed within reach, but (future Kraken??) Yanni Gourde and Vezina finalist Andrei Vasilevskiy propelled Tampa in the end. At least for our model’s sake, thank God.
After three rounds, our model has performed well in the playoffs, ranking 2nd among all public models in log loss. (Damn you Colorado). However, as we mentioned in our Round 1 writeup, the playoffs are incredibly random and hardly a robust environment to properly evaluate a model like this. This isn’t really the time or place, but I think it’s time we stop using playoff model performance as a gauge for which models/modelers deserve credence or not. Anyway… The biggest driver of our (good) results so far, ironically enough, has been the model’s opinion of the two teams left in the playoffs. Seems like kind of a rock / hard place type deal for us now. As you’ll see below, we have one team as heavy favorites for the finals. While we almost always root for the model, I have a sneaking suspicion we might be cheering for the underdog this time. At least Shawn probably will.
Tampa Bay Lightning (1) vs. Les Habitants (2)
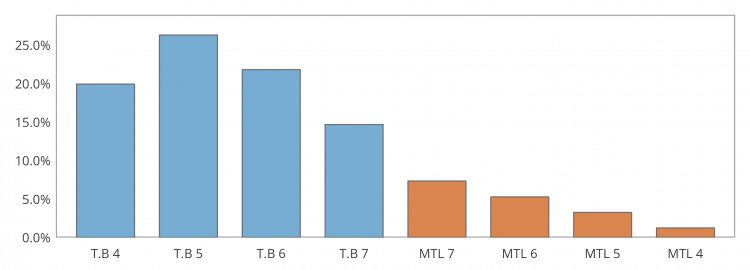
82.8% 17.2%


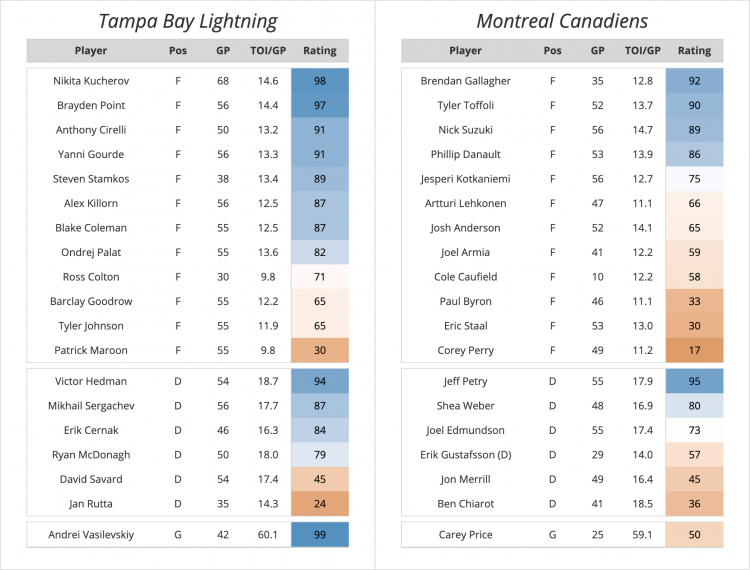
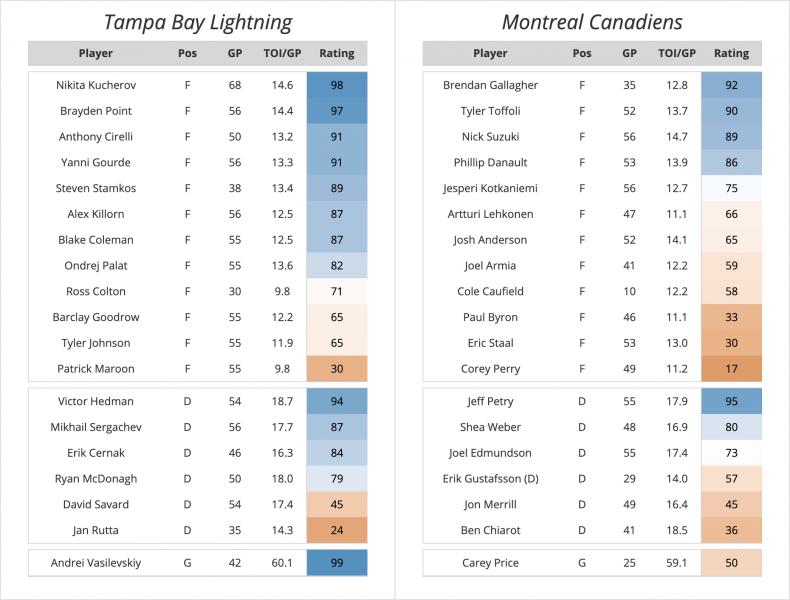
The Lightning enter this series, once again, as heavy favorites. Through four series including the finals here, they’ve averaged a 77.6% chance of winning each series. Averaging probabilities isn’t proper, but you get the idea. Tampa improved on some of their underwhelming EV shot metrics in the prior rounds against the Islanders, but they have still relied quite heavily on the phenomenal performance of Vasilevskiy and a (lower than it was before) 27.33% shooting percentage on the powerplay. The Canadiens feel oddly similar here; Carey Price has returned to his mid-2010s form it would seem after two very pedestrian regular seasons. I think it’s fair to say the goalie of the Stanley Cup winner will be the Conn Smythe winner as well (although Kucherov’s points in the playoffs and return after injury may influence things). Montreal’s powerplay has also been clicking during this run, but not at the same pace as Tampa’s. Why does it always feel like I could just say “the team with the best goalie will win”?
At this point though, it feels trivial to list off various numbers and stats when discussing this series. It’s the damn Stanley Cup Finals. Even if the NHL playoffs are quite random and “hardly a robust environment” to work with models and predictions, it’s still absurdly entertaining. Montreal has the potential to bring the Cup back to Canada for the first time in nearly 30 years. Hell, for some reason even the other provinces have embraced Montreal as Canada’s Team (lol). They have a very fun, almost rag-tag group of players by “hockey” standards that have played extremely well in 17 games so far. The Lightning have been here before, winning it all with a similar roster one season prior. On paper, the Lightning are the favorites, but on paper is not the same as on the ice (you like that one?) – at least in a seven-game series. Let’s go chaos and randomness and nonsense. The Stanley Cup Finals baby.
Until next year,
Josh, Luke, and Shawn

First again.
CJ
🙂
Where can I find this chart?
Damm i guess the evolving hockey staff doesn’t really care anymore lol
Sorry we missed this! Currently these charts aren’t available on the site – we made them specifically for the playoff preview articles. We plan to add a similar chart for teams over the summer. We’ll likely have an announcement when they get added.
Oh ok thanks!