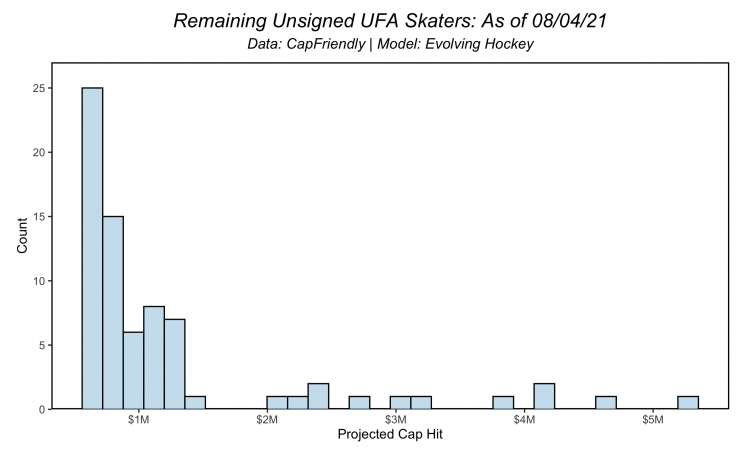
The NHL offseason in 2021 has been quite something. Within the course of a week we experienced the following: 1.) an expansion draft for a new team, 2.) the entry draft, and 3.) the start of free agency. I suppose that’s what a condensed season extended into summer will do when the league is attempting to return to a “normal” season schedule for the ’21-22 season. NHL free agency began one week ago yesterday, but we’re already at the point where a review article feels appropriate. Almost all of the remaining “high-end” free agents are RFAs – or rather, only one UFA with a projected cap-hit over $5M per per our model is still available (Tomas Tatar). As the linked tweet here states, a little over 60% of the NHL skaters we projected a contract for have signed new contracts. Of those, less than 80 UFA skaters remain who have not signed a new contract, and only 12 of these skaters have a projected cap hit of >$2M per year according to our model. Here’s a quick reference:
Given all of this, it seems like a good time to review how our contract projection model has performed so far, how and/or if the free agency environment in 2021 changed from years prior, and how teams did overall in their efforts to lock-in contracts for players heading into the ’21-22 season. As always, we need to give a huge shout out to CapFriendly for their incredible site and data. All contract data in this article is from their wonderful site.
Model Overview
Let’s do a quick review of our model and how it works before we get into this. The current model we use is essentially the exact same as the one we covered in-depth here, with a few changes that are covered in our glossary. To summarize, the “model” is actually more of a system that consists of two separate models. The first model predicts a given player’s most likely salary cap % (cap hit / NHL salary cap when the contract was signed). For example, Cale Makar’s new contract carries a $9M per year cap hit. The current salary cap is $81.5M. This means Makar’s cap % is 11.04%. All contracts in our model dataset are converted to this figure, and our projections are then converted back to standard cap hit (cap % * salary cap). This allows us to keep all contracts (historical and new) on the same level when training the model and making future predictions as the changing salary cap in the NHL year-over-year is accounted for by the cap % figure.
The second model predicts a given player’s most likely term or contract length. Unlike the cap % model, which is a continuous variable (regression is used), the term model is categorical. There are only 8 possible outcomes for any given player (1-8 years per the CBA). Historically, there were longer contracts than 8 years, but for our sake in training, all of the >8-year contracts have been reduced to 8 years. The term model generates a probability for all 8 years (0-1, which total 100% for all 8 years), and the highest % for a given year is the “projected” term. If you’re familiar with how we’ve displayed the projections on our site, you will likely have seen the eight probabilities listed for each player/contract projection.
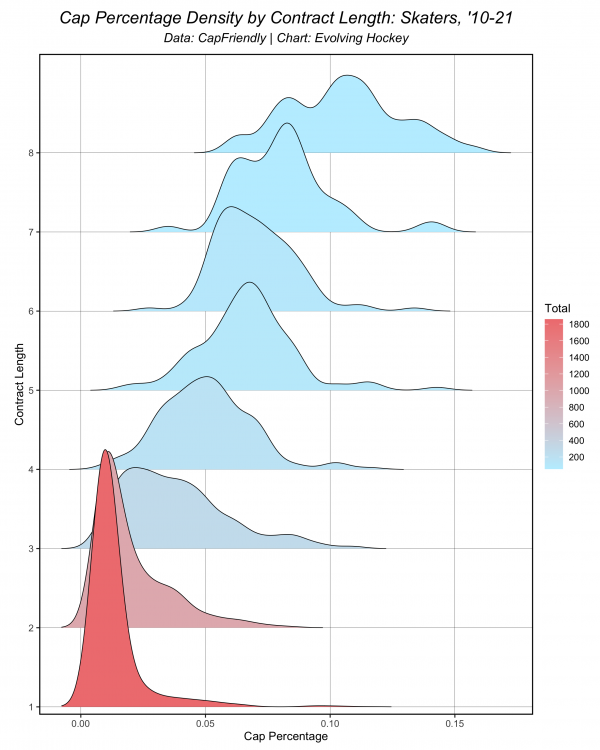
What connects these two models together is how the cap % model uses a contract’s term as a feature for predicting a given contract’s value. As we covered in the previous article, a contract’s length is very significant in determining how much we should expect that contract’s cap hit to be. We’ve seen pushback and criticism of the model over the years on this idea, but it’s very clear in the data that as a contract’s length increases, so does the corresponding dollar amount. This chart is in our previous article, which also shows the total number of contracts signed since 2010 at all terms, but it also demonstrates this relationship:
Model Evaluation
Let’s look at how the model has performed so far before we get into specific player and team evaluations with regards to free agency. Here’s a quick summary of where we’re at with data:
- Our contract projections went live 05/01/21. We are evaluating our projections from this date on. About 2/3 of all contracts signed since then were signed during free agency (starting 07/28/21). Only 5 contracts were signed prior to the 2021 NHL season ending.
- We projected contracts for 393 free agent skaters in the NHL.
- Players who did not have NHL playing time in the ’20-21 season do not have a projection.
- We, as of yet, have still not gotten around to contract projections for goalies (sorry).
- Through 08/04/21, a total of 240 free agent skaters have signed contracts. 153 remain unsigned (about 40%).
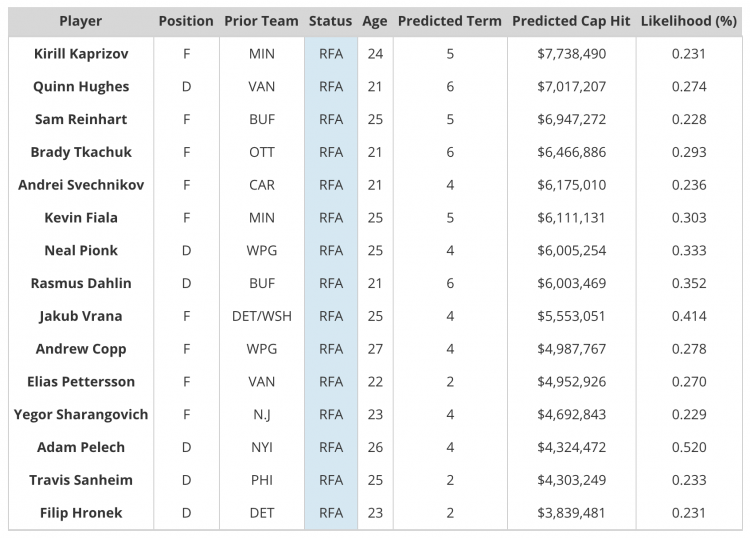
- Of the remaining 153 skaters left, 79 are RFAs and 74 are UFAs. As noted above, only 12 skaters with a projected cap hit over $2M per year remain. All other “high-end” free agents are RFAs.
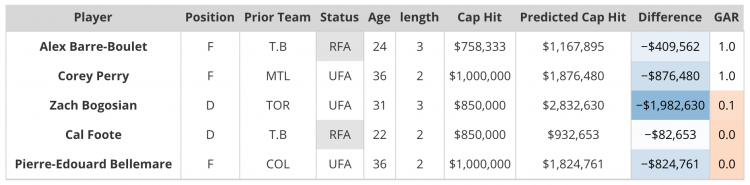
For reference, there are give or take 15 “major” RFAs left to sign a contract as of this publication:
Here is a look at how our projections compared to the actual contracts signed:
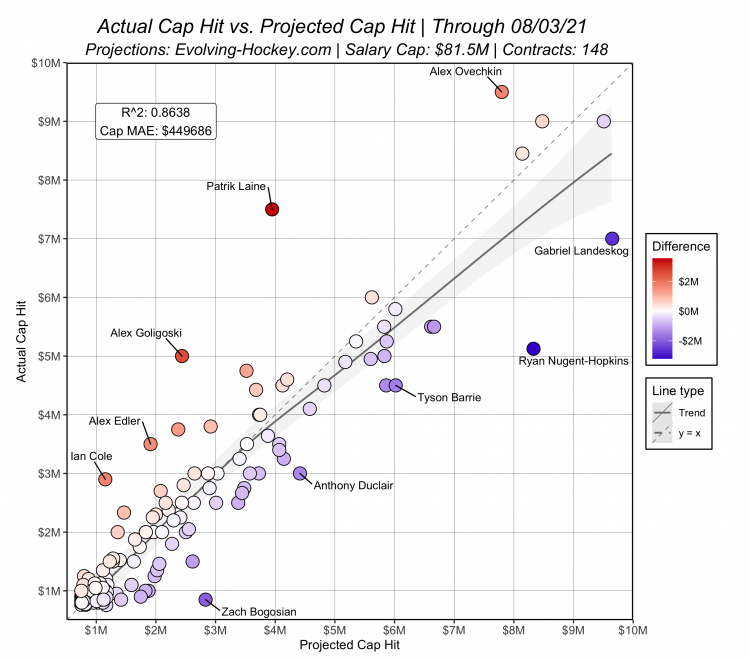
We’ve used this same chart to evaluate our model for several years. This year, however, after some additional research, we’ve decided to remove players who signed a league-minimum contract ($750k) in our evaluation. So far, there have been 89 contracts signed at league minimum. We projected 62 contracts to be at or below league-minimum (a reminder: we round all contracts that are projected to be below the league minimum up to this minimum). Of those 62 projected contracts, only 11 were signed above $750k. Basically: predicting which players are going to sign at league minimum 1.) is not particularly relevant, 2.) is relatively easy compared to all other players, and 3.) inflates our evaluation metrics due to point 2. Yes, by removing these contracts we are “hurting” our model performance, but it is misleading to include these contracts when evaluating performance in our opinion.
Here is the same chart, but I’ve highlighted the difference in UFA vs. RFA signings:
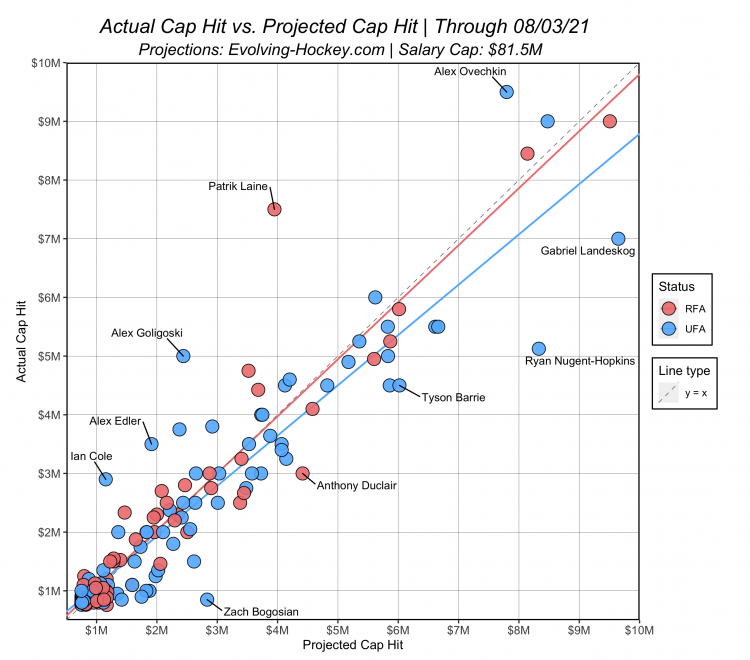
And a few evaluation metrics for both groups:
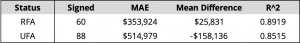
It’s not entirely evident from the first comprehensive chart above, but so far, UFAs are signing contracts under their projected contract, while RFAs are signing contracts roughly in line with where we might expect them based on our model. This trend (RFAs in line w/ expectations, UFAs under expectations) has gotten more pronounced since the 2020 free agency period where we saw a similar trend with UFA contracts (a reminder: this included league-minimum players).
The distribution of actual – projected contract difference (still excluding $750k contracts) also shows a similar trend:
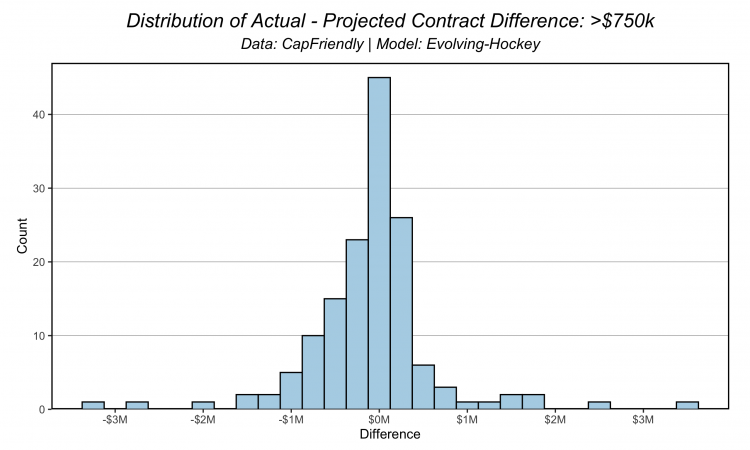
The real driver of the UFA under-signing for lack of a better term, is in the -$500K to $1M difference range (Cody Ceci, Wayne Simmonds, Mikael Granlund, Brock McGinn, Mike Reilly). This is balanced out in a way by the number of players who were signed between the $250k and $500k over-range (Jamie Oleksiak, Taylor Hall, Alex Wennberg, Jake McCabe, Adam Larsson) and $1.5M – $2M over-range (Alex Ovechkin, Ian Cole, Alexander Edler). There is a definite skew toward the under-projected range in the current environment based on our model, but this is almost exclusively seen in UFA signings. While many will assume this is a product of the “flat cap”, and it may very well be the case, it’s important to remember that the prior two seasons were both shortened, the COVID-19 pandemic completely altered how the NHL was played two seasons, and the future of the league and any revenue/monetary aspects in the NHL are still hanging in a cloud of uncertainty. The flat cap, at least in my opinion, is only one factor in the current contract environment.
Player Value
Alright enough about the boring stuff eh? Which team did the worst in free agency? I’m assuming that’s what you’re all here for right? Too bad, you had to read through all that stuff above right [For the Better, Right? meme]. A reminder here that I won’t be evaluating trades and maybe more importantly extensions (Seth Jones, Werenski, etc.). This will be a look into how players who needed new contracts were signed.
On Evolving Hockey, we not only have contract projections for your viewing enjoyment, but we also maintain a comprehensive GAR projection system for NHL skaters (again no goalies, sorry but not really). Combing this GAR projection system with our contract projection system allows us to analyze signings not just through an actual vs. projected contract standpoint, but from a “how good do we think the newly-signed free agents will be” standpoint.
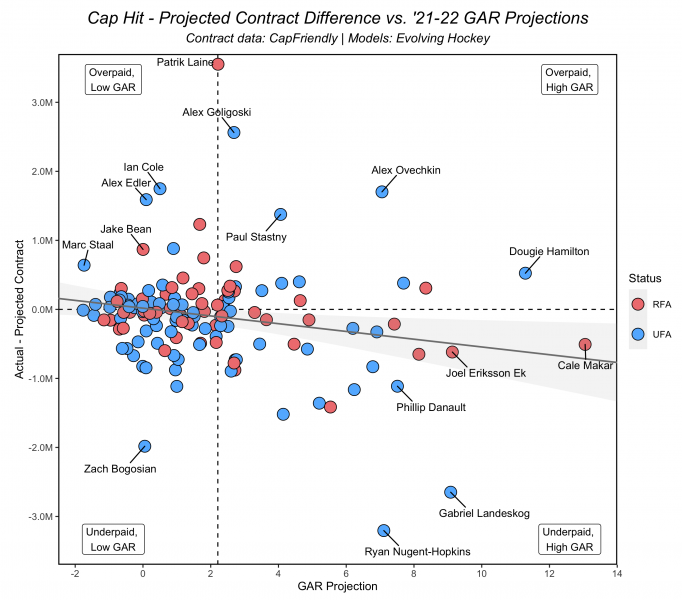
First, let’s look at the player level:

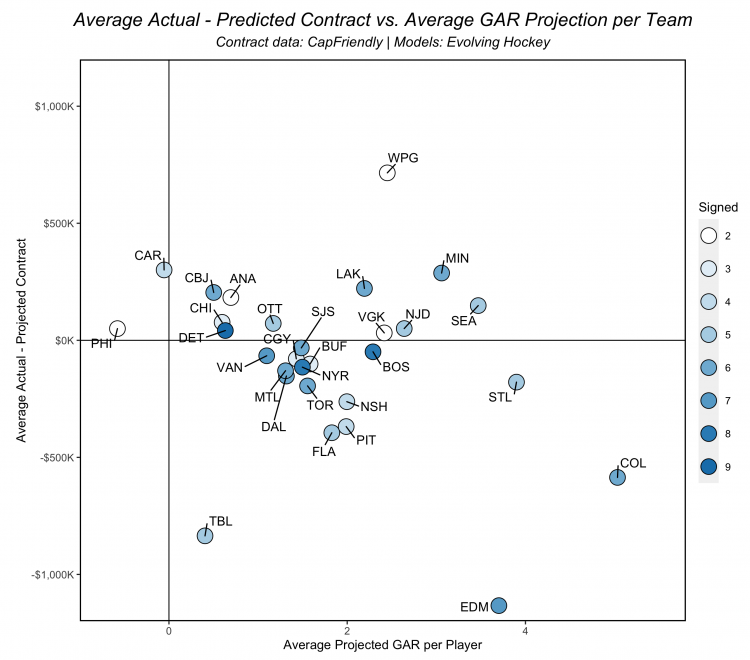
Here’s a quick breakdown of what’s going on here:
- I’ve divided this into quadrants with labels for each. This is not scientific in anyway necessarily, just a guide for what the chart is showing. Please don’t get mad at me for using underpaid and overpaid. That’s not really what this is, but it’s the simplest and shortest way to label this.
- For continuity, I’ve kept both RFAs and UFAs in to show all players
- The players labeled are the outliers – not in the statistical sense of the term, but based on where they fall
One thing of interest here is the line of best fit. While a crude view, on average, players were underpaid for their expected GAR value heading into next season. It’s important to remember we’re only projecting next season’s projected GAR and not the projected GAR for the length of a given contract. We could probably do this, but I’m not particularly fond of applying a standard aging curve to individual players for contract evaluation. I won’t get into it too much here, but this type of evaluation is often not all that helpful – this type of “contract value” mostly resembles a polynomial trend line starting at next season’s GAR projection and falling off every year after that. Applying age curves to individual players is tricky, and neither of us have quite figured out how to best do this.
Additionally, it is noteworthy that there are far more players in the “Underpaid, High GAR” and “Overpaid, Low GAR” quadrants than the other two. For the former, it seems the market still undervalues defensive value (especially for forwards here): Eriksson Ek, Danault, and Landeskog are all top-20 players in the Even Strength Defense component of our GAR projections. This is still clearly one of the biggest market inefficiencies in the league in my opinion. Otherwise, the trend isn’t that far off from the difference? Good players based on our GAR projections were mostly paid what one might expect from the market, and vice versa. Again we see similar variance in the spread, a few older intangible defensemen getting overpaid, and a soon to be 36-year old Alex Ovechkin getting an unheard of deal while still being good. There’s also Zach Bogosian.
Team Value
If we take a similar approach as we did above, we can look at teams in a similar manner. However, things get a little trickier here. Two teams have only signed one non-league-minimum player (Washington and Arizona), and three teams have only signed two of these players (Anaheim, Philadelphia, Vegas, and Winnipeg). However, we must try I suppose. Please keep reading for a few caveats. For the purpose of evaluation, I’ve removed the teams that have signed only one player. As mentioned before, I’ve also removed all league-minimum players from these charts. Please stick around since one team in particular goes against the common narrative going around right now – I wonder who it could be.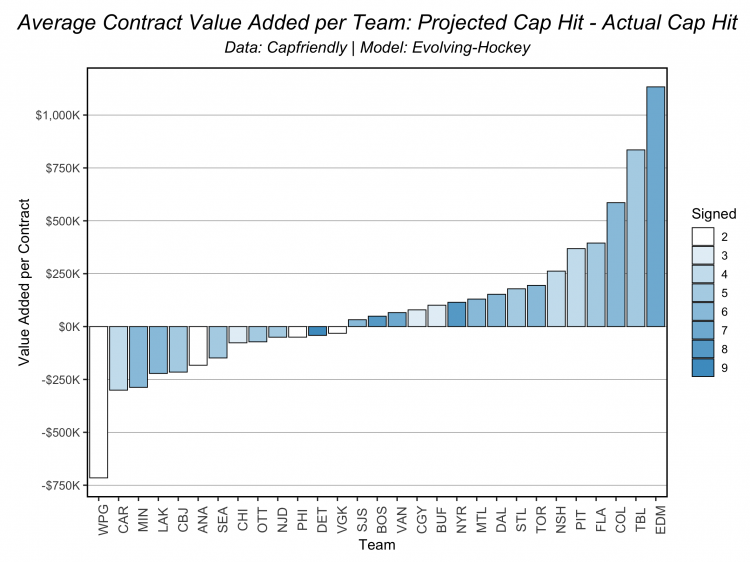
Numerous teams are clumped together in the middle here. Some signed a lot of players, others signed fewer – these are teams we’re not all that interested in. Vancouver signed a bunch of players for about what we might expect them to be worth, all while being not particularly good. We don’t care about Vancouver. Calgary and Boston are here too. But Edmonton, St. Louis, and Colorado? Maybe even Seattle and Tampa? That’s the good stuff. Philly is the bad stuff so we’ll avoid that.
Edmonton
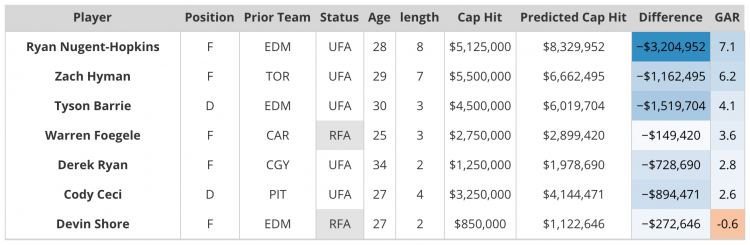
While a few of these players do not necessarily have a sterling reputation, the only player the Oilers signed that we project below replacement level is Devin Shore. Nugent-Hopkins and Hyman are projected to be 80th+ percentile players next season, and their other signings while maybe not stellar, are solid overall. Oddly, every player the Oilers signed came in below our projected contract. RNH is a big outlier in our model, but even getting Hyman and Barrie over $1M under our projections (even if the game plan from Edmonton’s front office is possibly shoddy) is still impressive all things considered. I wouldn’ say the Oilers did the best here, but I also won’t say they didn’t do the best. Or something.
Colorado
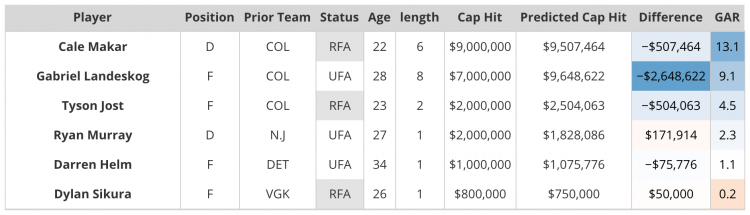
The Avalanche’s place in the “underpaid, high GAR” quadrant is helped significantly by the re-signing of Makar and Landeskog – both players are in the top-4 projected GAR for free agents signed this offseason so far (1st and 4th respectively). Without these two, they’d be much closer to the rest of the teams per this view. The only player they signed over our projection was Dylan Sikura, who we project to play less than 300 minutes next season and has played 53 games in the NHL in the last 4 seasons. Like Edmonton, Colorado saved a significant amount on Landeskog’s cap hit here based on our model (although the 8-year term and full no-move clause for the 28 year-old carries a lot of risk). No one expected Colorado to do well here (strike that, reverse it).
St. Louis
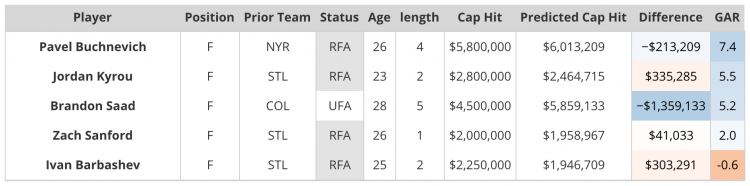
St. Louis made some very good moves this offseason all things considered. The Blues’ acquisition of Buchnevich from the Rangers will likely be the best trade and/or signing of the offseason (still have no idea what the Rangers were doing there). Four of the Blues’ signings were RFAs, and three previously played for the team, so they’re not necessarily fully comparable to the other teams. However, the team has had a solid offseason so far. It will be interesting to see what happens with Tarasenko going forward.
Seattle
The Kraken had a plan. Or at least, I think they did. Like many assumed after their expansion draft with the amount of cap space they had available, Seattle ended up being a big player overall – and this table doesn’t include the two goalies they signed (Driedger technically counts as an expansion pick, but he signed a new contract as part of the draft). They did add the fourth most GAR per player with their skater signings, and both goalies are at bare minimum good (although the decision to sign Grubauer to that contract is certainly interesting). Time will obviously tell how their approach this summer pays off, but there’s little doubt they improved in the short term with their signings here.
Philadelphia I said I wasn’t going to talk about the Flyers. Instead here’s the table:
Winnipeg
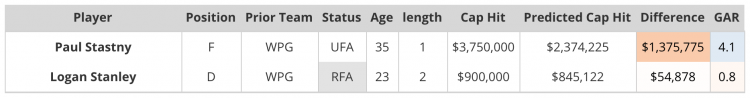
Winnipeg isn’t particularly interesting here in general. They signed Stastny to a contract that was much higher than our model thought it would be at 2 years. Stastny is still a serviceable player given his age. I’m mostly showing these signings because they look like an “interesting” team in the above chart, but they’re really not.
Tampa Bay
Tampa managed to sign five (mostly) replacement level skaters to contracts all under what our model projected. I’m not really sure what to make of that, and I don’t necessarily know what to even say about this. I just think it’s noteworthy and also kind of funny. Per CapFriendly, the Lightning currently sit at exactly $0M in cap space with Brent Seabrook’s LTIR’d contract being deducted. I have to think they could’ve added some better players here, but at least they saved a bunch of money adding the ones they did? Or… well. I mean they’re the Lightning. They’ll figure something out.
Detroit
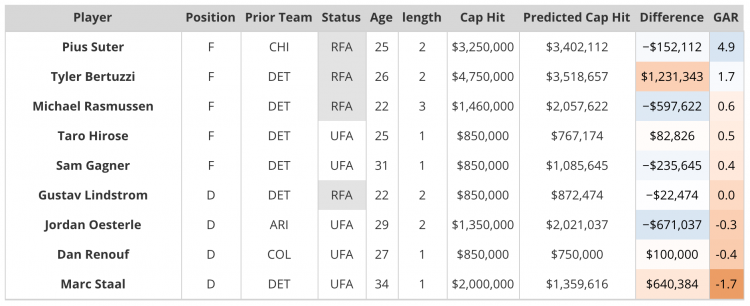
The Red Wings have signed the most >league-minimum players so far. They aren’t particularly interesting, and most of these players are at or hovering just above replacement level. I’m mostly just showing this chart because the team signed a lot of players.
Recap
While there are still a decent number of players who haven’t signed, other than the remaining RFAs, few will likely make headlines outside of the chart-posters on Twitter.com. Only five UFAs with a projected GAR over 2 remain unsigned (Tatar, Krejci, Palmieri, Cizikas, E. Gustafsson [D]) – of these, at least two are likely determined, and one has committed to another league. Our contract projection model continues to perform well, especially given the uncertainty of the last two shortened seasons, COVID-19, and flat salary cap. When we first created the model, it was much more likely to “miss” under on the high-end contracts (under-project the actual). In today’s environment, at least for UFAs, players are taking less than we might expect. It’s not extreme (the flat-cappers out there can chill a bit), but there is a definite trend developing for later-20s and early-30s UFAs. 2022’s free agency will be quite interesting. I have a feeling a lot of GMs are going to be looking at some very hefty asks from their young defensemen. Just a hunch.
Does the “Average Contract Value Added per Team” chart include league minimum signings? I.e. Jason Spezza for Toronto?