The summer is officially over. Outside of a handful of RFA holdouts and regardless of whether teams are ready are not, the ’24-25 NHL regular season begins today! Sure, it begins in Prague and hasn’t been marketed in any way to non-European audiences, but that doesn’t change the fact that we needed to finish our team projections a little earlier this year. We’re not getting this out today because we procrastinated at all, we’re getting it out now because the league decided to run regular season games while preseason games were still being played and that caused some problems! So, it seems fitting we’d wait until the last minute (ok fine, we procrastinated a little bit).
Just like in years past, we thought it would be a fun little task to share our Preseason Team Point Projections with some classic Evolving Hockey Commentary attached. First let’s cover how the model works and what you can expect from the projection system!
Model Info
This is an updated version of our explainer from the previous description here.
Our team probabilities are generated in a three-step process. We use a model to project “future” value for all players, use these player projections to build a game probability model that projects the winning % of any given team matchup using logistic regression, and then feed these individual game probabilities into a Monte Carlo simulation that generates the outcomes for all games in a season. To complete this process, each team’s player projections are aggregated into Forward, Defensemen, and Goalie groups, and various metrics are used for each group which are then fed into the game probability model. With these inputs, we can generate home and away team winning percentage values. Once we have all home/away probabilities projected for each game in the season, we prepare the simulation.
For each game in the simulation, we only care about the projected winning % for the home team. Take a game between a home team and an away team. The process laid out above gives us a winning % for each team. We replace the away team’s projected probability with a random % between 0 and 1. If the home team’s projected winning % is higher than the random number, they “win” the game (they “lose” if it is lower). This is done for each game in the season and then repeated tens of thousands of times. Once the simulation is complete, we check how many times each team won a game, sum the total games won, and arrive at each team’s projected point total.
The first step is generating multiple player-level models, which produce ratings for all players in the league. For skaters, we found our xSPAR metric (Expected Standing Points Above Replacement) as well as a custom “game score” model (built using Box Score metrics) works best for predicting future team game outcomes. Our SPAR and RAPM metrics were also tested but they did not perform quite as well for this specific task. The “game score” model we are using is similar to Dom Luszczyszyn’s Game Score model; however, we tested various box score metrics and weighted them through a “grid search” approach to optimize predicting future team game win probability. For the simulation, we set the schedule for all teams, add in the projected game probabilities, and then run the simulation.
We still use a roster-level system, project various metrics for every player for next season (notably xSPAR and our own “game score” metric), determine the roster for every team (new this year, we’re gratefully using Tim Hiebert’s rosters from The Hockey News and research for injured players), aggregate those individual projections into team ratings for forwards / defensemen / goalies, and compute game probabilities for every game in the ’24-25 schedule. We then run a Monte Carlo simulation 50,000 times with all of that in place to project point totals for all teams in the league. As the season progresses, this simulation is re-run with updated data.
Team Point Projections
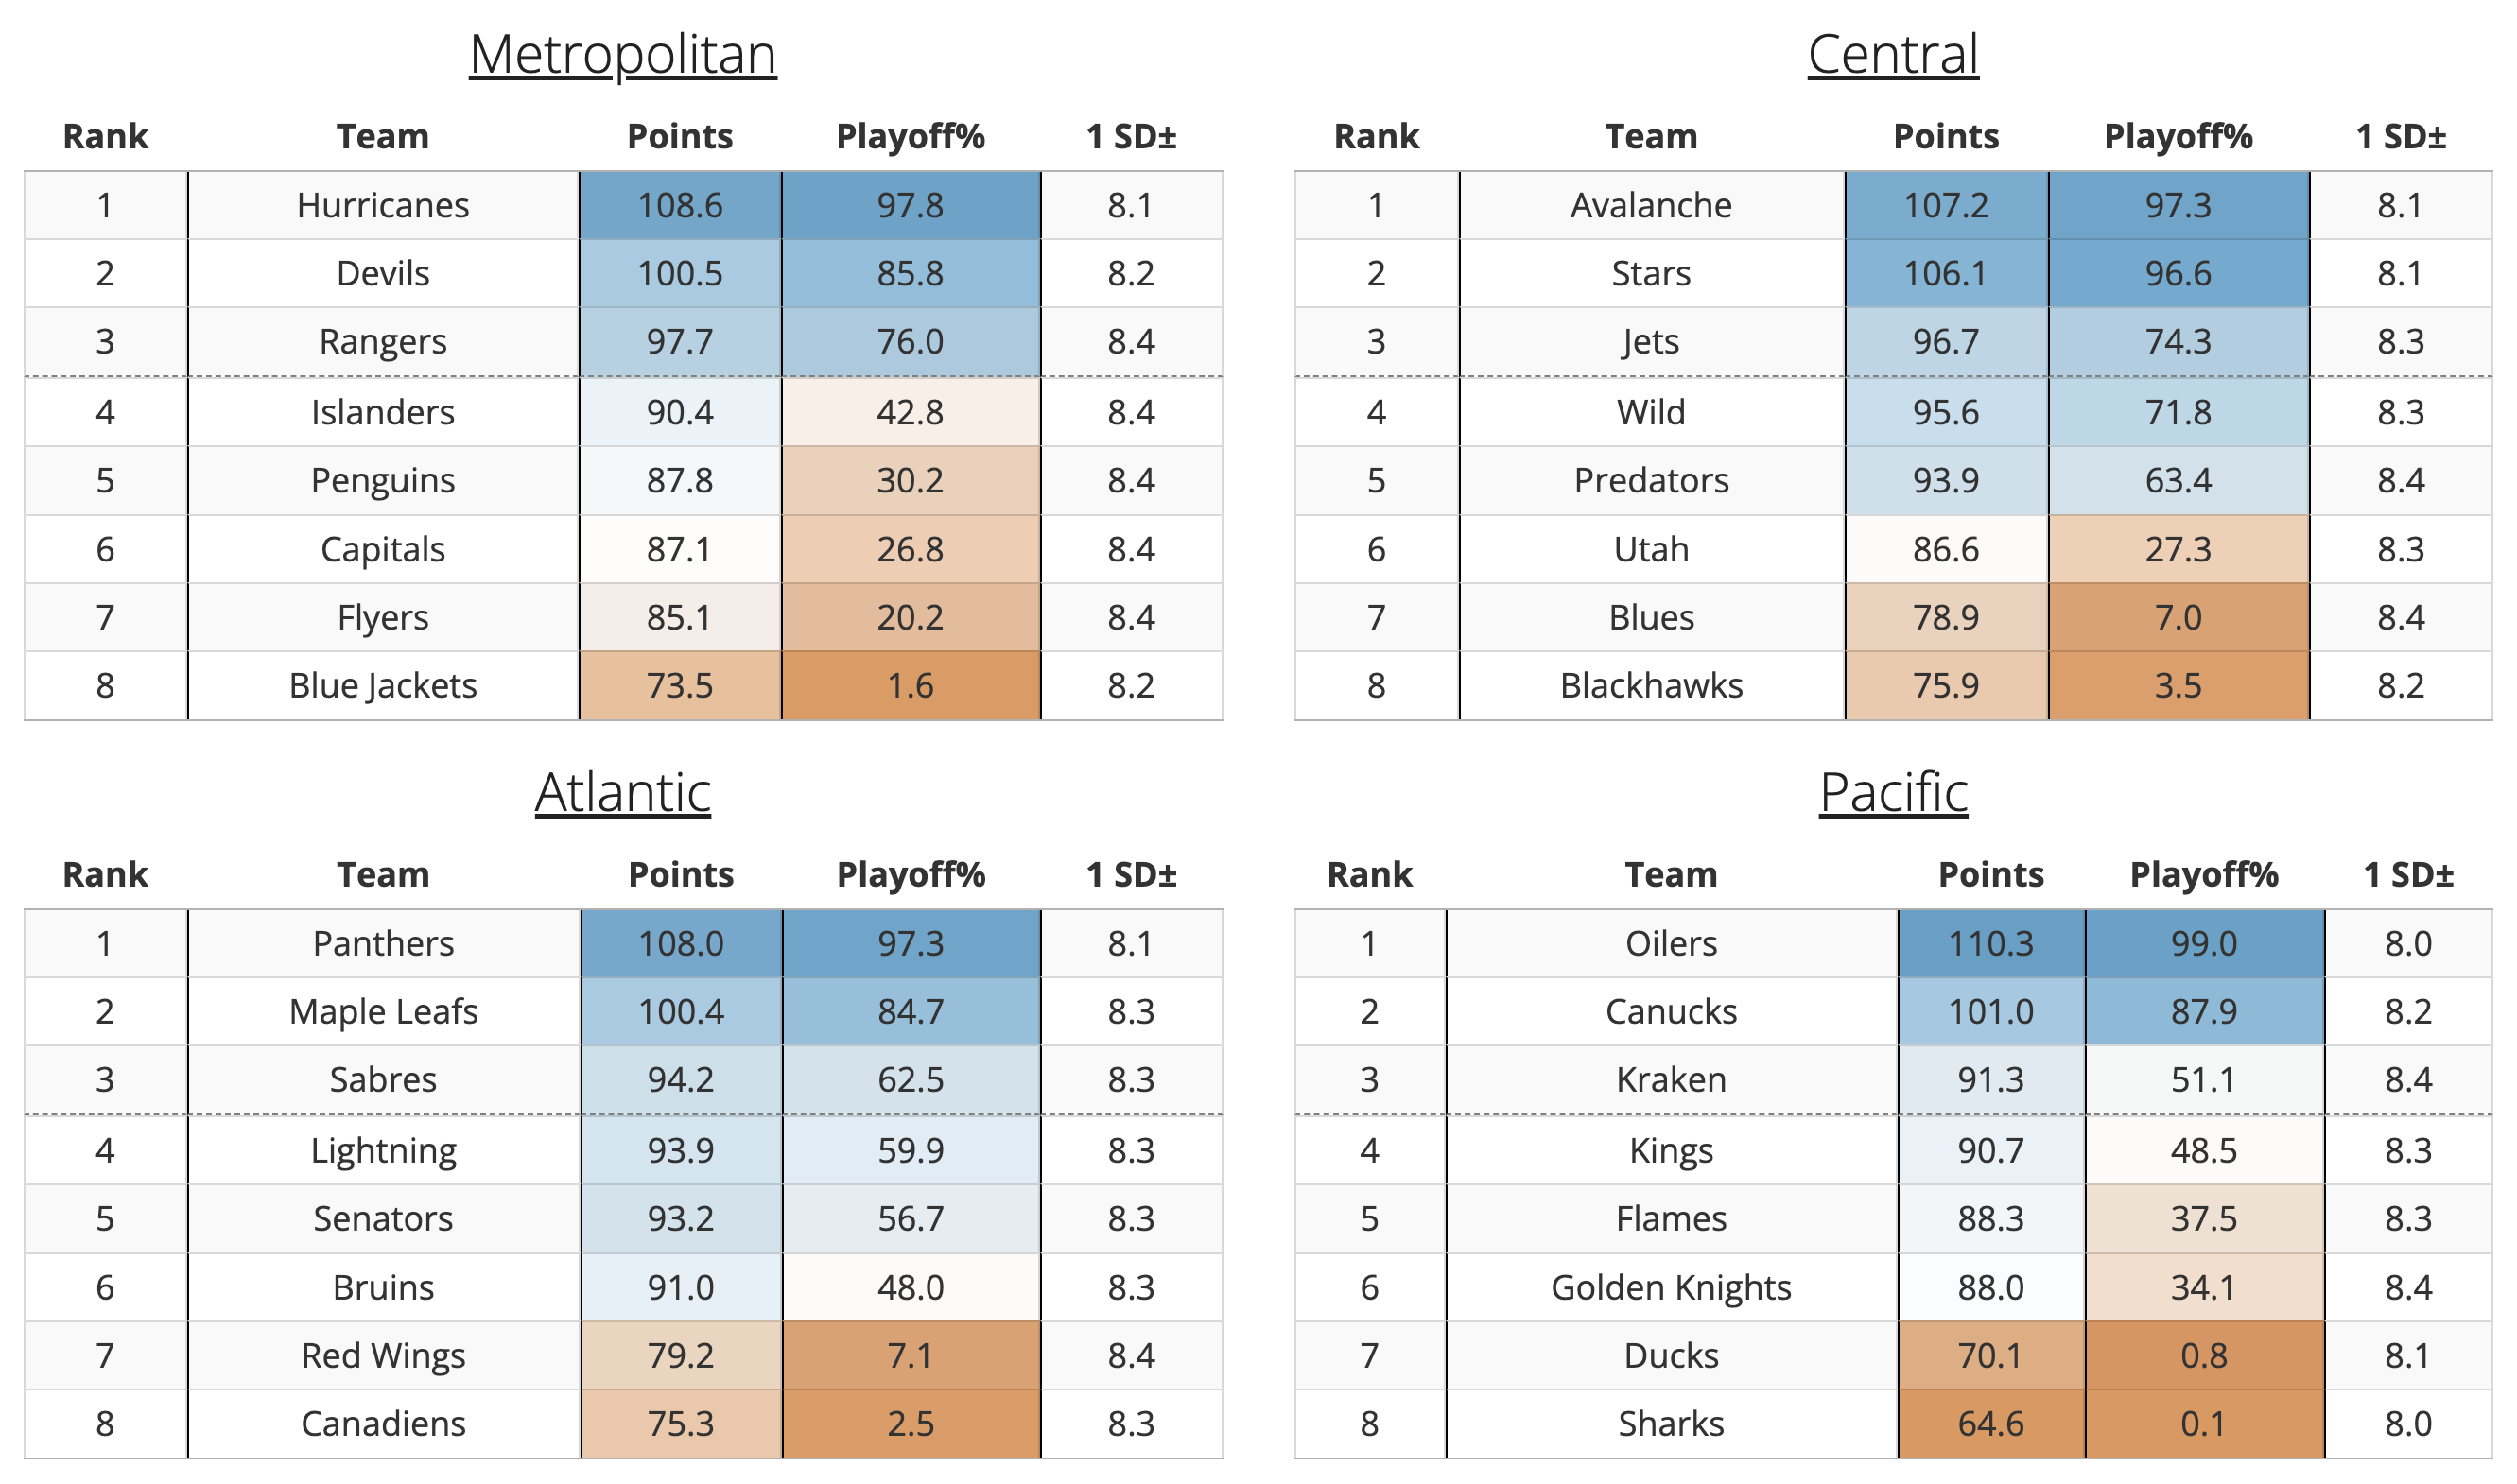
For those familiar with our Team Projections on the site, these are updated daily as the season goes along. We attempt to account for injuries the best we can based on “expected” return dates and anticipated substitutions, but there is always uncertainty when it comes to missed time in the NHL. As of right now, we’ve used a combination of Tim Hiebert’s projected starting rosters along with our best estimate for when injured players will return in the season and who will likely take their place during their absence. Ok, onto the team discussion.
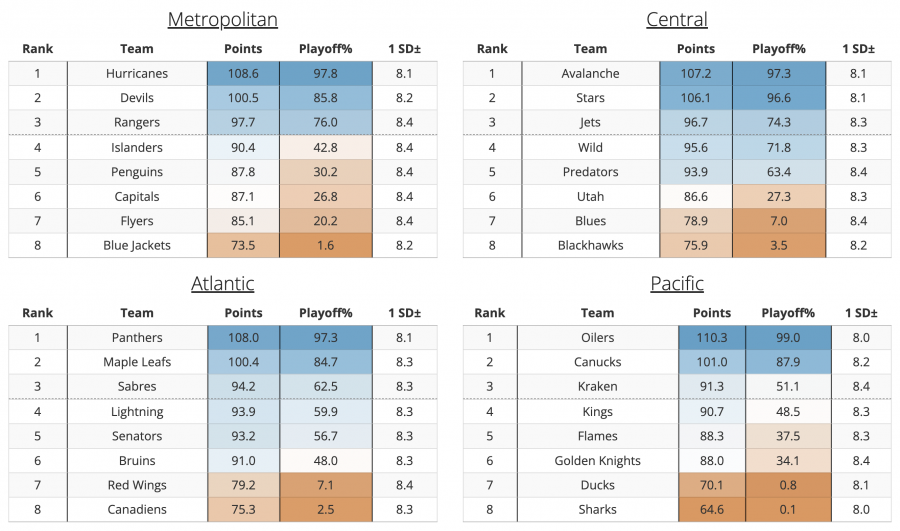
Let’s take a quick look at our median projected points for each division:
- Metropolitan: 89.1
- Atlantic: 93.6
- Central: 94.8
- Pacific: 89.5
Interestingly, the Central has improved quite a bit this season compared to last. Per our projections heading into the ’23-24 season, they were the worst division based on expectations, but they now enter ’24-25 with the highest expected median point value. I’m only mentioning this because we’re Wild fans and it’s important that I have some evidence as to why my favorite team struggled in the coming year since they are, clearly, playing in the hardest division in the league.
Metropolitan Division
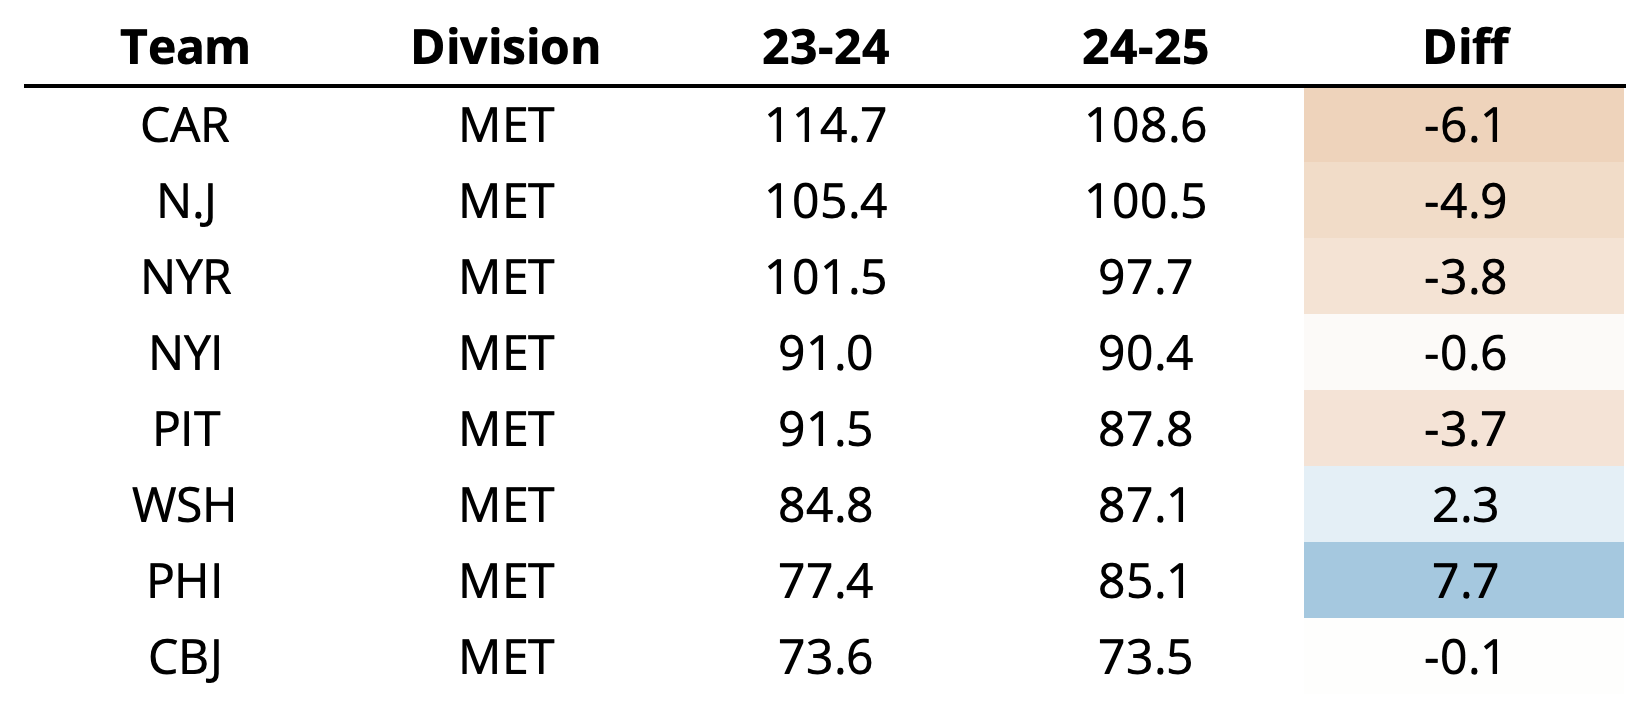
The big story last year, at least for us since we’re only concerned about our model(s), was the New Jersey Devils. A long-loved team by various models we maintain, they absolutely destroyed us. And we’re ready to get hurt again. Why shouldn’t we have hope, though? They’re bringing back a team that appears to have few holes outside of net. They’ve dropped a few points compared to last season’s quite high projection, but this is a team that should be very competitive. Unlike the Devils, the Hurricanes did almost exactly what we thought they would: dominate in the regular season and then do Canes things in the playoffs (ok, that’s not really fair). Few teams were as active during free agency, and as we noted in our Free Ageny review (https://evolving-hockey.com/blog/2024-nhl-free-agency-a-review/), they either added EH favorites or retained EH favorites. Carolina heads into ’24-25 with the 2nd highest projected point total (only behind Edmonton).
The rest of the Metro is a wash. Among teams outside the playoff picture, the Flyers improved the most, and while we do love ourselves some Foersters and Farabees and Catess, they still bring with them a lackluster lineup when compared to the heavy hitters this season. While the Islanders, Capitals, and Blue Jackets are bringing back similarly “strong” teams, the Penguins have gotten markedly worse comparatively. They still believe in the Crosby – Malkin – Letang core, and they did make some recent additions (Bunting, Grzelcyk, Beauvillier), but age catches up to all of us, and the model is reflecting that here. The Metropolitan projects to be the worst division in the league.
Atlantic Division
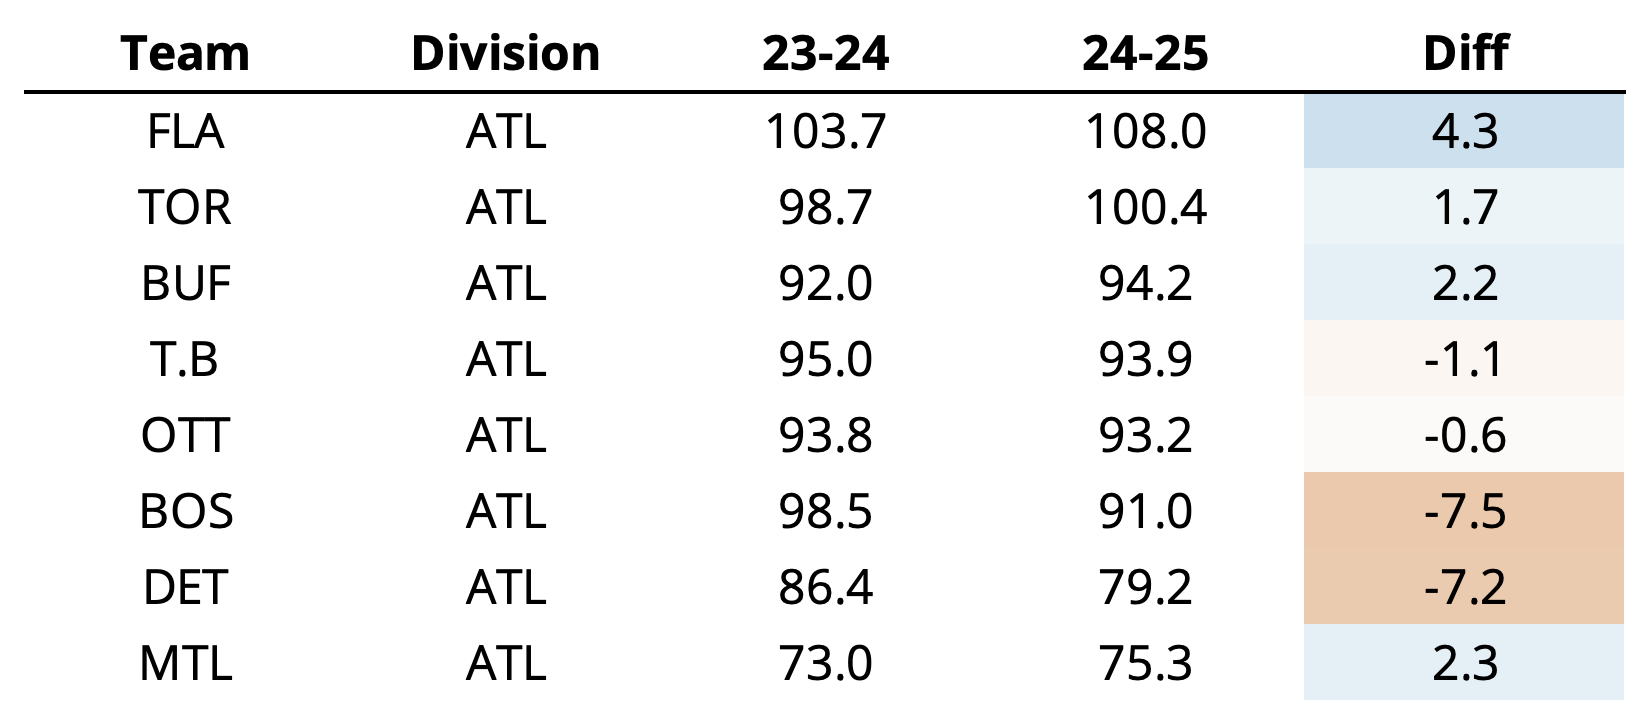
It’s no surprise Florida is bringing back, essentially, the same team that got them to the Cup Final last spring. They grade out as the 3rd best team in the league per our model (less than a point behind Carolina), and even after few additions this summer it’s clear they’re still one of the Cup favorites. Sure, a few of their players may be due for some “regression” (the bad way), but few teams bring a lineup as solid heading into ’24-25. The Leafs, on the other hand, tried their best to bring in a bunch of old guys and questionable free agents but still can’t stop Auston Matthews from impacting the model. Ok, Marner, Nylander, and Tavares are pretty good. Interestingly, Toronto actually improved a bit compared to our projections from last season, which may be the most surprising result among the Atlantic.
The real story, however, is The Sabres. 3rd in the Atlantic? Is that allowed? Look, they’ve only improved by 2.2 points compared to their projection from last season, and it doesn’t matter that they did very little this summer or that they face some very legitimate questions about their roster (UPL for Vezina), all they needed was their peers to fall off. Boston, Detroit, and Tampa really are doing some work here in the overall preseason projections among Atlantic teams. Tampa isn’t that surprising given the shakeup this summer and overall age heading into next season, but Boston (even with the assumption that Swayman will sign today) falls off quite heavily compared with last season. It’s not too surprising given their lack of depth outside of a few key players (Pastrnak, McAvoy, Marchand). I’m just preparing for another absurd goalie tandem year that will make us look ridiculous when they are first in the league and I run my evaluation for these projections in a few months.
Central Division
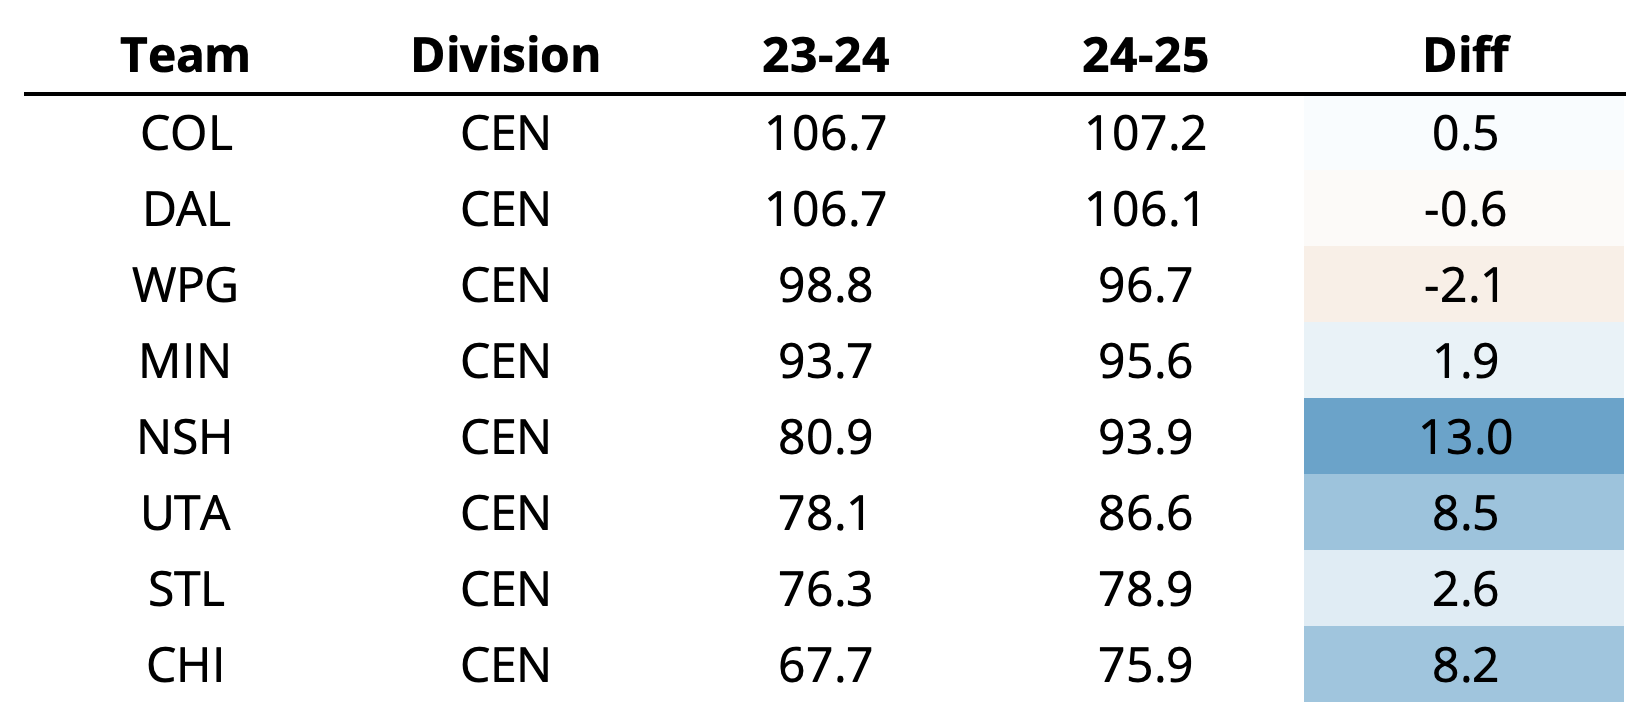
The Central. Now we’re getting to the good stuff. First of all, the Wild, eh? 4th in the Central? That’s what I’m talking about. Colorado and Dallas are expected here and given that few things have changed with either team let’s ignore them. The Jets and Wild also did very little, which rounds out the top 4, so let’s just ignore them as well and get to the bottom half. Nashville thinks they can win it all, I guess. Only Vancouver improved more compared to our projections a year ago, and while that’s admirable, it seems they still might be fighting for a Wild Card spot. As I noted in our Free Agency review, the Preds really did have a good summer. The surprising additions of Stamkos and the extremely efficient Marchessault contract made all of us here at Evolving Hockey turn heads. Are they really ready to compete for a playoff spot? Do they have what it takes? Probably not, but they’re doing something. That’s always admirable.
Chicago, while still projected to finish last in the division, improved quite a bit here (not necessarily a hard thing to do given they were one of the worst teams in the league last season), and even with a team that’s a few years away from playoff potential, it will be quite fun to watch Bedard come into his “own” as he enters his second season with a few more pieces around him. As The Utah Hockey Club joins the battle, we also see them entering a new era (86 projected points), and the Blues will continue to be bad unless Jordan Binnington has one of his 20% probability good seasons and Robert Thomas lives up to our Fantasy Projection hype for him.
Pacific Division
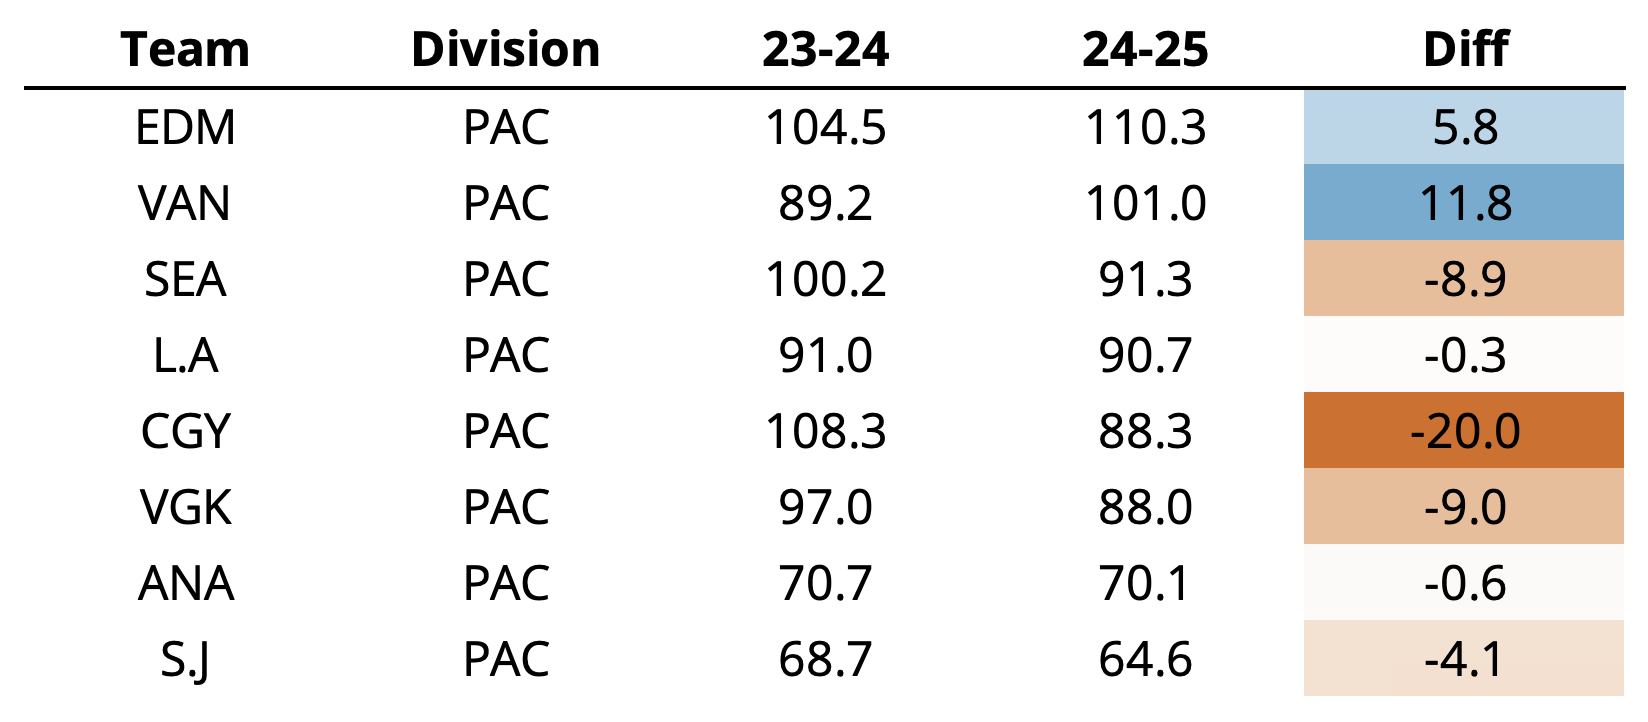
Among the four divisions, the Pacific is by far the most interesting. Only two teams “improved” compared to their preseason projections last year, and three teams are close to 9 points lower this season. Of those, we have the Flames. To be quite honest, we’re still not entirely sure what the model was thinking with its Flames projection last preseason. I suppose it’s good for the model to inject some batty results into our projections from time to time so you all know we’re not manually changing anything to suit our “feelings”. The Kraken are, likewise, in the same boat here, although they’ll still land in a playoff spot if these hold up. Vegas, not unlike the Bruins, did little this summer and while still rostering a strong team, they’re a year older.
The Oilers enter the ’24-25 season as the Evolving Hockey favorites. To be honest I never thought I’d see the day. There’s not much we can really say about this team that Oilers fans haven’t already made sure you know, but they did have a very good summer, and given a strong core and the obvious stars, it’s hard not to pick them as the Cup favorite. The Canucks follow behind, and after an impressive season last year and a very active summer (11 players we projected contracts for), they’ll be heavily in the mix out west.
Wrapping Up
After an extremely active but oddly boring offseason, we’re once again seeing the rotation of old cores and young talent. Just like I noted last year, there are still a few teams banking on their longtime franchise players performing like it was 2020 (Pittsburgh, Boston, Vegas), but we enter another season of promising players on the rise. After all the fuss we heard about teams waiting for the salary cap to increase so they could make a push or develop for seasons down the road with certainty, the favorites from last year seem to make up the favorites this year. Funny how hockey works sometimes.
Usually this is the part where I’d talk about the teams that we’re cheering for because we’re higher on them than other models, but to be honest, I don’t see a lot of those. Frankly, thank the Lord. Watching Calgary and Seattle and New Jersey struggle last year was a bad time. I think I’ll just cheer for the Oilers and the Canes because one of those teams has had problems with us in the past and one of those teams has a new GM that is a great dude. As always, I hope your favorite team does everything you hope, all of your dreams come true, and you have a great time watching hockey this season!
I think there are easier ways to figure this all out. That sounds like way too much work. LOL. Needless to say I can’t see most of these things happening. I would suggest listing how good or bad last seasons projections were.