
In the past, we’ve only ever released playoff projections on twitter with a short explainer (if that). This was almost entirely due to us not having a “good” way to host any kind of article or preview on EH in the past. As you have likely seen, we now have that ability! The Evolving Hockey Staff (Josh and Luke Younggren & Shawn Ferris) are here and at your service.
We’re not going to get into this too much (maybe a future article), but playoff projections have always been something we’ve done more or less just for fun. Part “I wonder which teams have a good chance of winning” part “why not let’s throw our numbers in the horse race with other modelers and see what happens”. Neither of us put a lot of weight in the outcome because frankly, the playoffs are very difficult to predict – 7 slightly weighted coin tosses between the same tossers so to speak, which are repeated, with less tossers, 3 more times. Trying to project who will win in the NHL playoffs is mostly a fool’s errand. But that’s what makes it fun. The regular season, the President’s Trophy, and maybe a few of the best players in the league are the things we can almost kind of predict. Still not well, because it’s hockey, but way better than the playoffs. The playoffs are pure chaos and entertainment. However, we here at EH like to enjoy the absurdity of it all and just watch for fun. (Of course we’ll still be cheering for our predicted winners). Let’s get into it.
Model Info
Our playoff probabilities are generated in a three step process. We use a model to project “future” value for all players, use these player projections to build a game probability model that projects the winning % of any given team matchup (logistic regression), and then feed these individual game probabilities into a Monte Carlo simulation that generates the probabilities for each series. In order to complete this process, each team’s player projections are aggregated into F/D/G groups, and various metrics are used for each group which are then fed into the game probability model. With these inputs, we are able to generate home and away team winning percentage values. Once we have projected all home/away probabilities for the playoff games, we prepare the simulation.
For the simulation, in a given game we only care about the projected winning % for the home team. Take FLA/TB. The process laid out above gives us a winning % for each team. In game 1, FLA is the home team. We replace TB’s projected probability with a random % between 0 and 1 since they are the away team. If FLA’s projected winning % is higher than the random number, FLA “wins” that game (they “lose” if it is lower). In game 3 when TB is the home team, we do the same for FLA (we replace their winning % with a randomly generated %). This is done for each team game in all series and then repeated tens of thousands of times. Once the simulation is complete, we check how many times each team won a game, sum the total games won in a series, and arrive at each team’s projected probability.
The first step is generating multiple player-level models which produce ratings for all players in the league. For skaters, we found our xSPAR metric (Expected Standing Points Above Replacement) as well as a custom “game score” model (built using Box Score metrics) worked best for predicting future team game outcomes. Our SPAR and RAPM metrics were also tested but they did not perform quite as well for this specific task. The “game score” model we are using is similar to Dom Luszczyszyn’s Game Score model; however, we tested various box score metrics and weighted them through a “grid search” approach to optimize predicting future team game win probability. We hope to improve this method and explain it fully in the future. There isn’t really anything special about our simulation. We set the schedule for all teams, add in the projected game probabilities, and then run the simulation.
Central Division
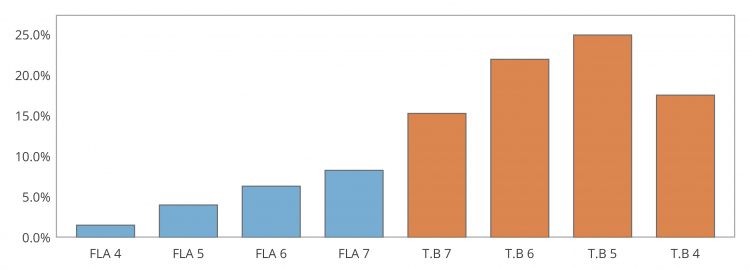
Carolina Hurricanes (1) vs. Nashville Predators (4)
67.9%. 32.1%
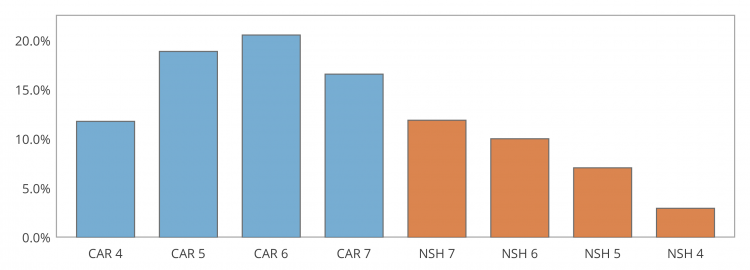
The predators are a team that’s been about as average as any team could be in a season. However, an idea of average like this misses their absurd positive shift in both shooting and save % between the first and second half of the season. This was likely the main reason for their ability to edge out the Stars and grab 4th in the Central. Their skater group, in the past, has been one of the best supported by a consistently excellent top-4 D group. This season they’ve been much more unstable. Still a decent team, their D corps has taken a step back, while their forwards have remained mostly unremarkable. Their forward group lacks a true elite talent, and is likely the worst in the playoffs this year. Goaltending may prove to be their one saving grace if they can pull off a series win. It’s not unthinkable that Saros could destroy numerous brackets early.
NSH strengths: Saros, top defensemen
NSH weaknesses: all the forwards, instability
The Hurricanes are likely one of the best 5 teams heading into the playoffs. Possibly the best top-4 D in the league (albeit a shaky 3rd pair), one of the more underrated forward groups in the league, including a revitalized Nino Niederreiter, young darlings Aho and Svechnikov, and a very consistent Vincent Trocheck. Not unlike how they’ve played over the last few years, their team EV numbers are still among the best (both shot attempts and xG). This season’s Hurricanes team, however, has found a gem in Nedeljkovic in net. We’ve erred on the side of caution here and have Mrazek starting, but Ned’s 23 GAR in 23 games is an impressive feat. Even if they start Mrazek (it’s still not clear who will get #1 duties), the duo is one of the stronger tandems in the playoffs. The only possible negative for the team is their somewhat below average shooting talent compared to the rest of the league. If they struggle, it would seem almost unpleasantly fitting if it were due to a poor stretch of low shooting %.
CAR strengths: skaters, goalie, coach
CAR weaknesses: (I’m not going to say shooting but it might be that)
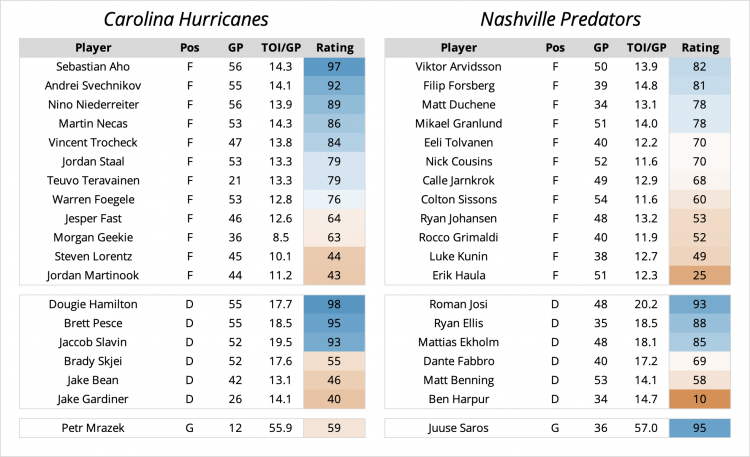
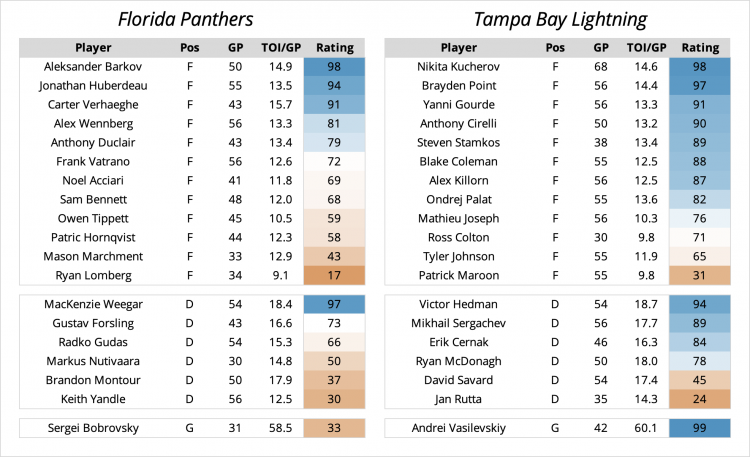
Florida Panthers (2) vs. Tampa Bay Lighting (3)
20.2% 79.8%
Could you ask for a more flavorful series? Both Florida teams, both very good, in the first round? Ok maybe you’d like these guys to meet in a later round for the drama. Either way, this might be the most interesting matchup this round.
The Panthers are this year’s “surprise” team. Fellow analytical intellectuals have always viewed a few of FLA’s players as dark horse award picks. This season specifically, Mackenzie Weegar has turned into a bonafide EH star: 4th in xGAR only behind Chychrun, D. Toews, and Makar. (Shoutout to the EH GAR projections that called that one, don’t look at Panarin). They also roster the true surprise player this season in Carter Verhaeghe, who has had an absolutely stellar year. FLA’s roster was one of the most improved from the 2019-2020 season per our GAR model with big improvements from Barkov, Duclair, and Bennett. Unfortunately, Aaron Ekblad’s injury is a big blow for the team. FLA is already quite top heavy, lacking depth when compared to other contenders, and his loss further extenuates that. FLA also has a big question in net; depending on who lands between the pipes, FLA’s probability changes substantially. Along with Carolina, whoever they end up going with will greatly impact their chances (they probably shouldn’t go with Bobrovsky).
FLA strengths: their stars, breakout players
FLA weaknesses: Bobrovsky, skater depth
It’s kind of boring at this point to heap praise on Tampa, but here we are. The reigning Stanley Cup champions, the Lightning are still good. Quite good actually. And just like the Blackhawks of 6 years ago or whatever who seemed to be able to cheat whenever they wanted to and magically rest (injured) players only for them to be suddenly ready for the playoffs, Tampa is not only getting a healthy Kucherov back, but may also get Stamkos back as well. Our model, even with the missed season, still has Kucherov as the ~5th most impactful player in the playoffs. Without him, their probability here drops ~5-6%. The Lightning are an experienced, well-rounded, and extremely deep team still within their never-ending window. Only COL enters the 1st round with higher odds of advancing by our model.
T.B strengths: being Tampa
T.B weaknesses: people are over them
East Division
Pittsburgh Penguins (1) vs. New York Islanders (4)
61.9%. 38.1%
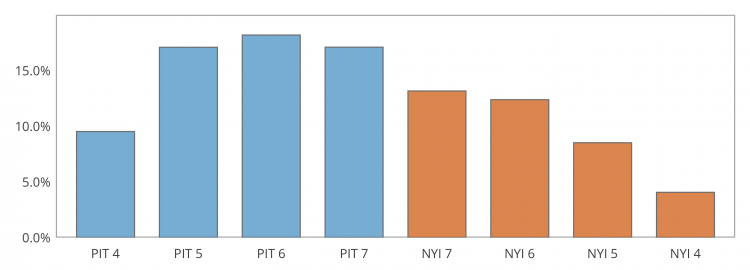
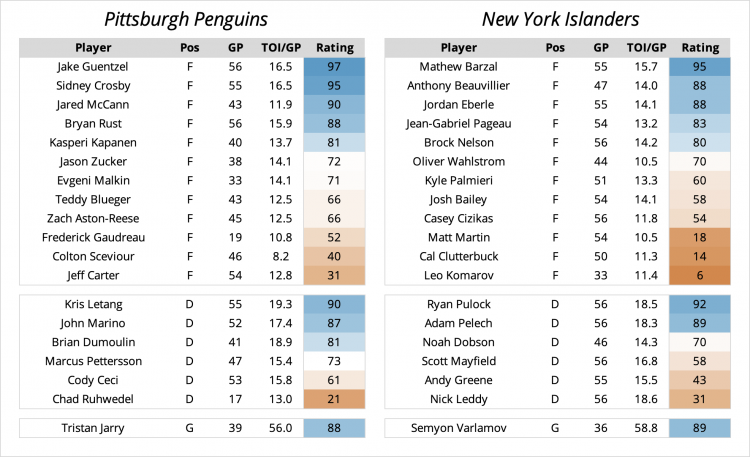
For birds that can’t fly, the Penguins have somehow flown under the radar this season in their conquest of the east division. Perhaps that is for good reason. While the Penguins have outscored their opponents at even strength this season thanks to efficiency in both shooting and goaltending, they finished the season with an underwhelming xGF% of 50.0%. This is much worse than the other division winners who all finished 54%+ in the top 5. The Penguins have been led by Jared McCann, as we all expected, who leads the team with a GAR of 17.9. The next Penguin in line is Sidney Crosby with 9.3. While he isn’t a household name, McCann’s well-rounded game, along with his ability to create positive penalty differentials, makes him a real difference-maker. Watch for him to log a few points and stop a few rushes in this series. The Penguins also bring a potent powerplay with only the Oilers and Hurricanes scoring at higher rates. However, their penalty kill has been weak, giving up goals at the fifth-highest rate. Penalties in Penguins games mean more than most.
PIT strengths: shooting, powerplay
PIT weaknesses: penalty kill
Under Barry Trotz, the Islanders have had some interesting metrics. They finished 6th in the league and 1st in their division in EV RAPM xG ± per 60 at 0.218 but finished 19th in the league in EV RAPM Corsi ± per 60 at -2.14. The Islanders take shot quality to the extreme. Looking at their goal components, 0.35 of their 0.45 goal differential per hour at even strength comes from their ability to take, and not give up, high-quality shots. Of course, the team is led by their star center Mat Barzal, but don’t sleep on the stable Adam Pelech who finished second among defensemen in EVD GAR at 7.5. Oh…and he has a pretty good defensive pair in Ryan Pulock too. For the 784 minutes that the two of them have been on the ice this season, the Islanders have controlled 61.6% of the expected goals. The Islanders are handicapped by a rather mediocre powerplay, but it is the only powerplay not to allow a shorthanded goal. Their penalty kill, which allowed goals at the 5th lowest rate, should be able to help combat the Penguins powerplay.
NYI strengths: anything related to defense
NYI weaknesses: most things relating to offense
Washington Capitals (2) vs. Boston Bruins (3)
38.6%. 61.4%
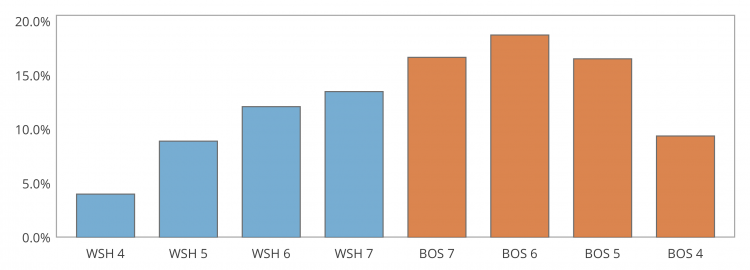
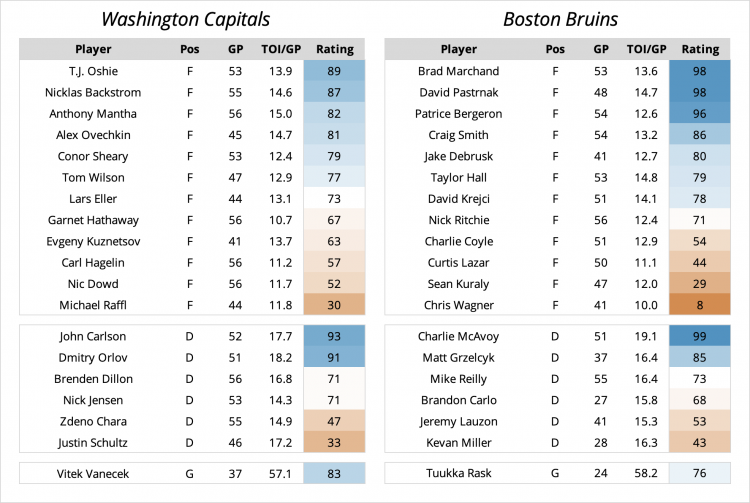
As in years past, the Capitals were a team that succeeded on the margins this season. While their share of shot attempts and expected goals were middle-of-the-pack at even strength, the Capitals were second in the league in shooting percentage, enabling them to outscore their opponents at a formidable margin. The Caps have been led by a re-emergence of Nicklas Backstrom who’s GAR of 11.4 was his highest season total since 2014-15 (11.9 in 82 games). One of the knocks for Washington heading into Game 1 will be the (possible) absence of Evgeny Kuznetsov. The forward has been a key contributor to the team’s offensive success for a while now and will at least be coming from a long break even if he plays in Game 1. One interesting stat to keep in mind heading into the series is the Capital’s .848 save percentage while on the powerplay this season. The Bruins, Brad Marchand in particular, have a knack for scoring shorthanded goals.
WSH strengths: shooting, depth
WSH weaknesses: everything else is just all average
If this preview is good for anything, let’s establish a precedent that we should never refer to the grouping of Brad Marchand, David Pastrnak, and Patrice Bergeron as the “perfection line” ever again. The Bruins have scored 2.24 more goals than their opponents with those three on the ice this season, but there is a new sheriff in town. Since Taylor Hall arrived in Boston after the trade deadline, he has been predominantly placed with David Krejci and Craig Smith to the right of him. With that trio on the ice, the Bruins have scored 4.03 more goals than their opponents…with a .983 save percentage. However, they were expected to outscore their opponents by a significant amount too. While the Bruins finish the season on the opposite side of the spectrum in terms of finishing at even strength this season, they are certainly hoping the Hall trade has alleviated that a bit.
BOS strengths: defense, goaltending
BOS weaknesses: shooting
North Division
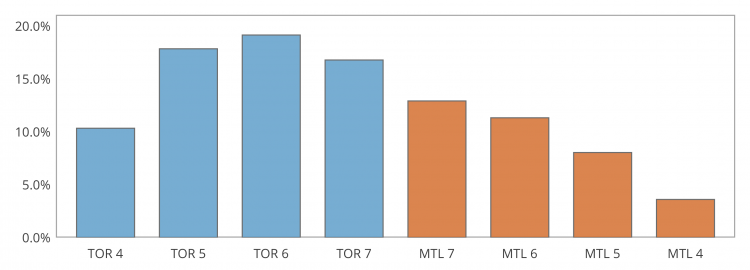
Toronto Maple Leafs (1) vs. Montreal Canadiens (4)
64.1% 35.9%
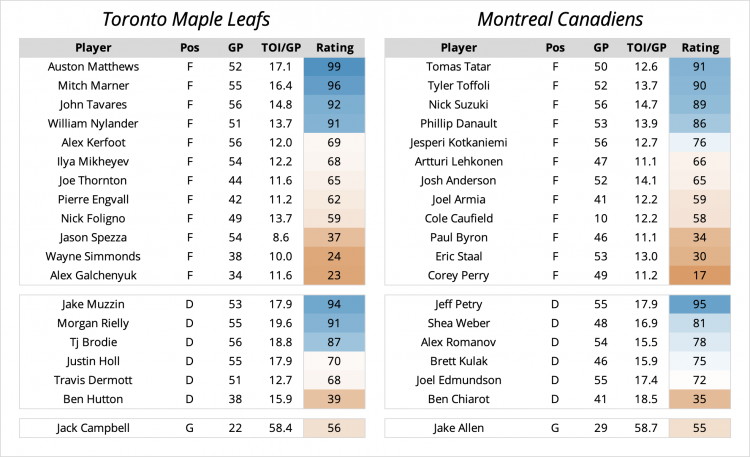
Once upon a time, it was 4-1 in 1967. The Maple Leafs are entering the playoffs division winners on the back of Auston Matthews’s 41-goal campaign. While there is lots of focus on Toronto’s high-flying offense, their improvement defensively is what may finally propel them past the first round. The Leafs finished the season with an EV RAPM xGA per 60 of -0.17, good for 8th in the league. This can be seen as a reflection of improvements to the back end under Kyle Dubas, with Jake Muzzin and TJ Brodie leading the way in EVD GAR. This is not to overlook the defensive commitment of Auston Matthews who finished 51st in EVD GAR, complimenting his impressive offensive contributions. However, despite terrific even strength play, and an immense amount of offensive talent, the Leafs have struggled on the powerplay for the majority of the season despite a great start. Since March 1, only the Ducks have scored goals at a lower rate on the powerplay. Furthermore, like the Capitals, they’ve given up their fair share of shorthanded goals. Do you have a lead against the Leafs? Go ahead and take some penalties and you’re sure to hang onto that lead.
TOR strengths: anything at even strength
TOR weaknesses: powerplay
Once upon a time, the Habs were projected to win the division based on our model. After a hot start, some thought that they were juggernauts. A few months and a coaching change later and somehow the boys of Montreal have clenched their hands on the last playoff spot in the north. Offseason acquisition, Josh Anderson, didn’t have his best season finishing with a GAR of -4.3. Phillip Danault also underwhelmed, at least compared to his reputation, with a GAR of 4.6. However, the Canadiens do have the ability to put more shots at the net than their opponents at even strength. They finished the season 3rd in the league with an EV RAPM Corsi ± per 60 of 8.15. Where they struggle is both in their ability to keep shots out of their net (28th in even strength save percentage) and convert their shots into goals (26th in even strength shooting percentage). This can be dangerous in the playoffs, as we saw in the bubble in the fall, where a sudden flash of luck can flip the switch on what kind of team the Habs are.
MTL strengths: out-possessing teams, the EH preseason blessing
MTL weaknesses: skill
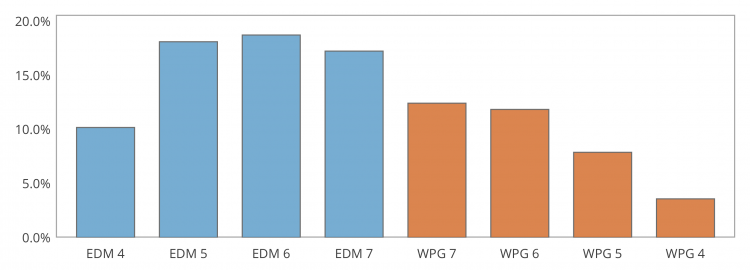
Edmonton Oilers (2) vs. Winnipeg Jets (3)
64.3% 35.7%
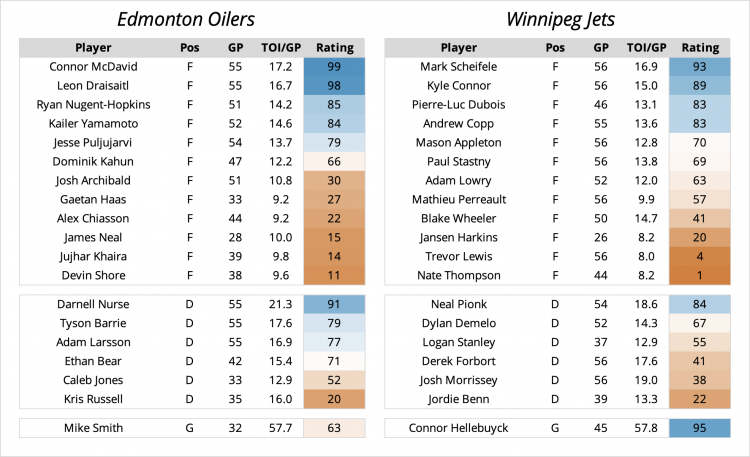
The Jets are an odd team. Now several years removed from their more or less solid days in the old Central division (which really didn’t last that long), they’ve managed to still put up some points this season with the help of Connor Hellebuyck and a fantastic season from Nikolaj Ehlers. The Jets forwards are rather top heavy, which has contributed to their pedestrian shot and xG metrics. While Scheifele slightly underperformed this season, he’s still one of the Jets best players. However, they have a handful of regulars who are not good, including one Blake Wheeler who has fallen far from his semi-Hart worthy days a few seasons back (although it appears he may be over some recent injuries), and their blue line may be one of the more “wait who plays D for the Jets?” groups in the league. Paul Maurice has a different view, but it’s hard to imagine what internal numbers WPG is looking at that would boost an evaluation of this team. To put it bluntly, without one of if not the best goalies in the league, it seems much more likely they might still be battling with CGY and VAN for the 4th spot in the North. This is one of the closer matchups due only to some of the Oilers similar holes, but the Jets don’t spark joy.
WPG strengths: Hellebuyck, internal analytics
WPG weaknesses: D, public analytics
Hello Oilers fans, our favorite fanbase by the way. The Oilers have two of the best centers in the NHL in Connor McDavid and Leon Draisaitl. McDavid is having one of the best seasons for a skater in the last 30 years. It seems almost unfair a team gets to also have a center like Draisaitl too. The wingers around each have performed quite well this year, especially RNH and Yamamoto. Their blue line has finally come together after years of searching, and given the Jets lack of D talent this will likely be one of the big strengths for the Oilers in this matchup (other than, you know, McDavid and Draisaitl). But after that? They probably have the worst bottom-6 forward group in the playoffs, which will prove to be a big weakness if they expect to make a run here, and it definitely brings their chances down against the Jets. Mike Smith has been better than we expected this season, but he’s 39 years old. And he’s Mike Smith. Regardless, this is one of the better Oilers team we’ve seen in a decade or more. While this team definitely is not perfect, it seems entirely possible McDavid might finally have enough supporting pieces to win a round.
EDM strengths: McDavid, Draisaitl, top-6
EDM weaknesses: 3rd/4th lines, (potentially) Mike Smith
West Division
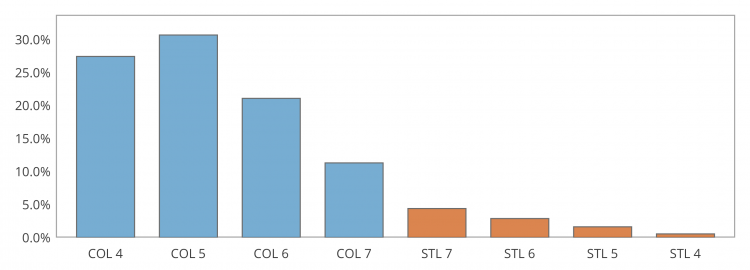
Colorado Avalanche (1) vs. St. Louis Blues (4)
90.5% 9.5%
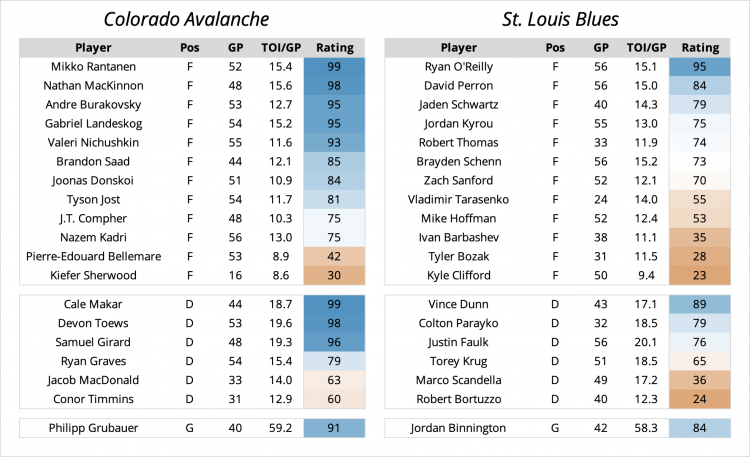
Sorry Blues fans. Unfortunately, Colorado decided to win out and take the President’s Trophy because they willed it into existence because they’re the ’20-21 Colorado Avalanche. But let’s not talk about them quite yet. Instead, let’s talk about the underwhelming Blues. Only two seasons removed from a Stanley Cup, the team has taken a fairly significant step back. Part of that is due to injuries and the last offseason. Losing Pietroangelo to Vegas was a big loss, and Krug wasn’t able to fully fill in the missing spot (although Pietro in Vegas hasn’t quite lived up to expectations). Parayko is declining likely due to injuries, and the team relied on Vince Dunn (who is quite good) and the oddly resurgent Justin Faulk to man the blue line. O’Reilly remains one of the league’s best centers, but it’s indicative of their roster. Their high end players are starting to age out, and so far the younger group hasn’t provided much value. Per our Team EV RAPM model, they’re the worst team in the playoffs by xG and only MIN has a lower Corsi ± per 60. It still seems the team matches up well against a few of the West teams (specifically MIN), so they have that. But by our model they’re one of the weaker teams in the playoffs … Watch them win.
STL strengths: play well it seems against other division teams
STL weaknesses: missing high end skaters outside ROR, they’re playing Colorado
And then there’s Colorado. Yes I know their probability here is ridiculous, but this Avs team might be the best team we’ve seen in the playoffs in some time and one of the strongest teams since 2007. In the last 14 seasons (since 2007), this Avs team would rank 3rd behind only the ’18-19 Lightning and the ’13-14 Bruins (prorating this shortened season for COL) in team GAR. By our models, they have 2-3 legitimate Norris contenders, basically only one semi-regular skater below replacement level in GAR (Conor Timmins – I don’t know who that is), and the obvious other greats in MacKinnon, Rantanen, Landeskog, and Nichushkin. As a team, their EV RAPM Corsi ± per 60 of 18.34 and xG ± per 60 of 0.8 are the highest rates any team had ever posted since 2007. To put that in context, only two other teams have managed an xG number in this timespan over 0.6 (’13-14 Sharks and ’09-10 Blackhawks). It’s hard to overstate how good the Avs skaters are this year. The *only* possible little weakness may be goaltending, as always, but our model doesn’t seem to have a problem with Grubauer at all. This team is nuts. And they’re playing one of the weaker teams in the playoffs … Watch them lose. (Oh God please not a repeat of ’16-17)
COL strengths: everything, all the time
COL weaknesses: none
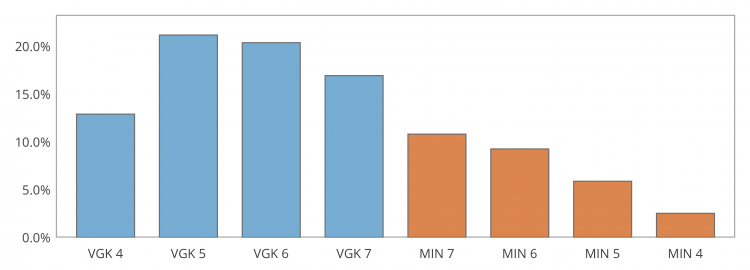
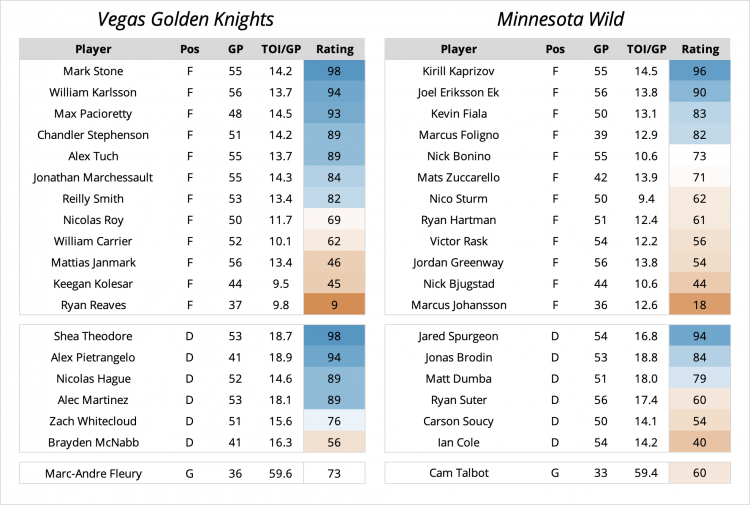
Vegas Golden Knights (2) vs. Minnesota Wild (3)
71.5% 28.5%
Well, we’ve reached the end. And what a fitting series to end it on. We may be a bit biased here, but I find the West matchups to be the most interesting. Based on our model, the Knights are *strong* favorites here. Vegas is more or less tied with Tampa as the 2nd strongest team in the playoffs behind Colorado.
The Minnesota Wild. What is this team? Let me break character here a little bit and just say, what the hell did Kirill Kaprizov do with my team. Well, he made them “fun” and “entertaining” according to all the new secondary fans the team has gathered this season. This is new to both Luke and I. In all seriousness, Kaprizov has been everything the team and the fanbase could’ve ever hoped for. A dynamic winger, a true top line elite talent, the kind of player the Wild have never had in their 20+ year existence. It’s been a joy to watch him play and progress. Our model has him as easily the most impactful player on the Wild, and a top 25 player in the playoffs. But one player does not make a team. They have severe center issues, their one good center (Joel Eriksson Ek) has been tasked with a more defense-first role, and Victor Rask has been trying his hardest to play like a 1C (he’s not but he’s been better than expected). The D group has taken a step back from year’s past, but Spurgeon has continued his stellar play, and Brodin/Dumba have been solid. But, other than Kaprizov, JEE, and Fiala, their offense is paper thin. The team’s forward depth is a mess, and Evason has mostly gotten lucky with an incredible amount of shooting % fortune if we’re being honest. In the past the team has relied on a similar quality over quantity approach to win games, and this year is no different. They even have somewhat “good” goaltending in Talbot, but something about this team feels like it was meant more for entertainment – they may have happened into an odd mix of luck and things working that normally shouldn’t. However, they have an oddly incredible 11-2-3 regular season record against Vegas since the Knights entered the league.
MIN strengths: Kaprizov, defense, things just going right for them
MIN weaknesses: haphazard forward group, unsustainable shooting %
I sometimes think about how before the Knights played a game almost everyone (including us) thought they wouldn’t be very good. Now look at them. Sure they’ve gotten lucky with some of their acquisitions, but they’ve made some very good moves as well. The combination of Mark Stone, Max Pacioretty, and the quite surprising Chandler Stephenson this season along with basically their entire D corps have continued to work wonders. While Alex Pietrangelo hasn’t performed like they may have hoped with his contract this year, he’s still been good. On top of that, Marc-Andre Fleury will likely be a Vezina candidate this offseason. They have few holes in their roster, are still the new kid in town to an extent, and did we mention Mark Stone? They have Mark Stone. The team is top 5 in all the important EV RAPM metrics, have no below average components in our Team ± Components metrics, and it’s hard to find a significant weak spot. The caveat? They’re playing… Minnesota? Who they just can’t win against it seems. Now, obviously, this is a 7 game series in the playoffs. As we noted at the start, we’re not adjusting for team vs. team splits or anything like that. On paper, VGK is a significantly stronger team. Can they overcome the odd matchup record against the Wild? Probably if we’re being honest. This plus their recent bad blood on the ice should make this a very interesting series.
VGK strengths: They have Mark Stone and Shea Theodore and D, no weak spots
VGK weaknesses: They have struggled against the Wild for some reason
I don’t need all this math to make my picks. I just sit on the toilet, pull out my media guide and go to the penalty minutes page
One time in 1994 larry brooks and I saw Mark Messier drink so much he threw up in a hotel fish tank. He would make a great leader for the Rangers these days too
That’s right. That definitely happened. I’m Larry Brooks so I would know.
Larry how are the kids? Unfortunately both of mine accidentally dropped their cell phones off a cruise ship on the same day and can’t talk to me anymore!
Kids today have no respect. That’s what I’m always writing in my columns at the New York Post where I’m pretty sure I write for a living.
These bloggers these days have no idea how to put a racist pun in their “articles.” This is why places like the NY Post are needed
None of your fancy numbers have anything about hits, or faceoffs! I’m an NBC analyst, so I would no how important these things are