
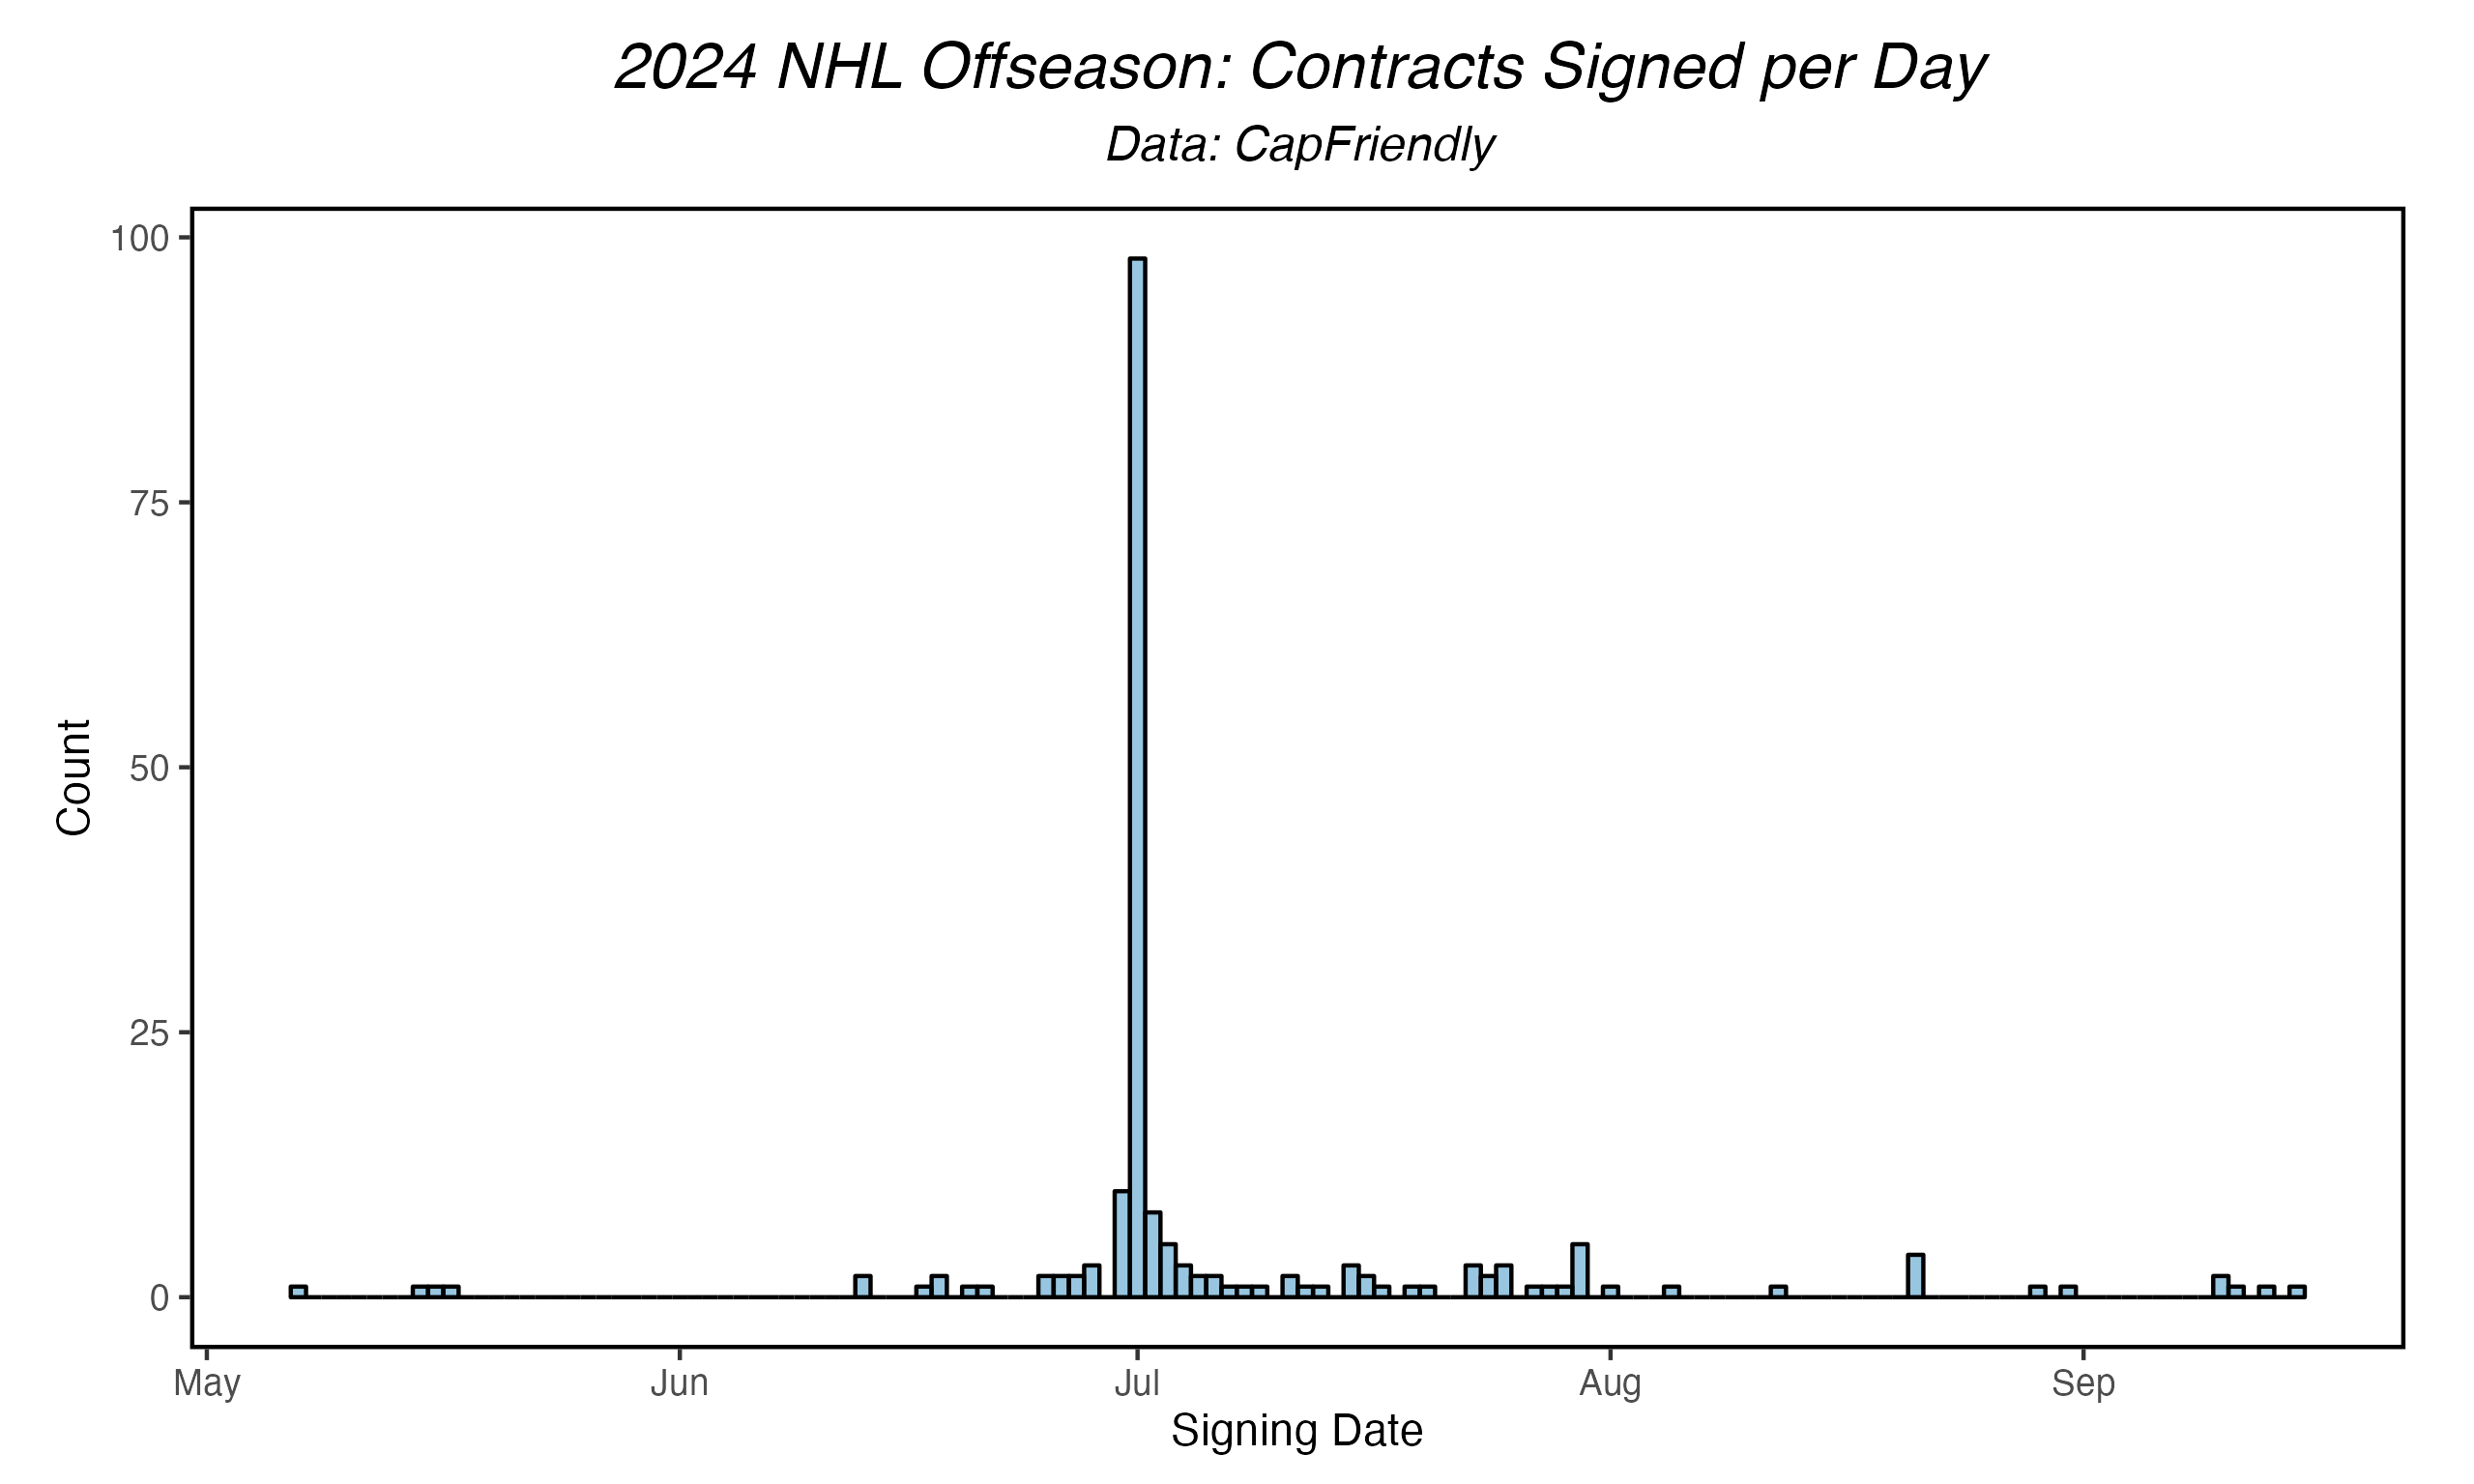
If you all remember, last year Elon Musk shut down Twitter on July 1st to specifically prevent any of us from having fun. This summer, we were only able to have fun on July 1st because every contract in the league was signed that day. More than $1 billion were spent in the first 12 hours of free agency, and then we all waited around for two offer sheets and some change. I’m not sure what people prefer, and to be honest, both maybe weren’t the best, but at least we could see what was actually happening this summer. Next year I think players should sign with enough regularity that I am personally able to be entertained for more than 1 day, but slow enough that I will not lose interest. This should be how this works for me personally.
Regardless, we’re now effectively done with the summer: the only remaining contracts are the RFA holdouts. At the time of publication these include Raymond, Seider, Swayman, Harley, Mercer, and Perfetti. As you may have noticed, we’re doing this Review later than we have in the past. We thought it might be a good idea to give the offseason more time to unfold as to acquire more observations for the evaluation of our model(s). It seems to make more sense, but we’ll also be evaluating this decision next year.
Ok, introduction over. It’s time for Evolving Hockey to evaluate Evolving Hockey’s various models. For the regulars, this shouldn’t be new – I’m following the same format I’ve followed for a few years now, but I’m still going to explain what’s going on here, so don’t worry one bit! Actually maybe worry, this is really long.
A note up front: with CapFriendly’s departure from the public space, we have now transitioned to a manual process to bring contract data in-house. This has been a big transition, but with the help of CF’s framework, it’s been much easier than it would have been otherwise (we can’t thank them enough). With this transition complete, we will continue to maintain our contract projection model for the foreseeable future and hopefully we’ll now be able to provide more contract data on the site! For this summer’s evaluation, we are using a combination of CapFriendly’s data through July 10th (when they went dark) and everything Evolving Hockey (us) have tracked since then (so far that’s ~80 Standard contracts signed). I’m pretty sure they’re all correct. Let’s go.
Method
Just like last year, we’ll be using the same methodology we’ve used for the past 4 years here – not much has changed overall. It’s a matter of evaluating a model that is still doing the same thing it’s been trying to do for over 6 years. For reference, here are a few links for those interested in reading further:
(Below from last year, the numbers have been updated below)
We provide contract projections for all players in the NHL here at Evolving Hockey. This is mainly focused on free agents in a given offseason (due to the large majority of new contracts being signed during this time); however, we also provide projections for every other player as well (including a handy feature to view extension-eligible players). The “model” itself is actually two models that we combine into one “main” projection: one model predicts the most likely length of a contract (1-8 years), and the other model predicts the most likely cap hit at the given term (in the form of percent of the salary cap – set for the expected salary cap of the next season). This results in a range of projections between one and eight years for all players. Our “projected” value on the site is the highest likelihood for a given term and the corresponding cap hit at said term.
For evaluation, we take all contracts signed since the model was updated (in this case, May 7th, 2024) and compare them to the projected contract at the actual term signed. A reminder: all evaluation that follows will exclude league-minimum contracts ($775k for the ’24-25 season). In general, league minimum contracts make up a good portion of the contracts signed in any given summer – 176 contracts signed among 392 we projected have been at league-minimum. Not only is this a large portion of all contracts signed in each offseason, they are also much easier to “predict”.
Data
Unlike last year, as I covered a bit up above, we’re using a combination of CapFriendly’s contract data through July 10, 2024 and our manually tracked contract data since then. Given the sheer number of contracts signed within the first week of July this year, there have actually only been 75 Standard contracts signed since then (this excludes all Entry-Level Contracts). For our purpose, we just need the usual attributes of a contract for the model to both use for training and evaluate after the fact (term, cap hit, player age, signing date, etc).
A few other data notes:
- Skater metrics used here are from Evolving Hockey
- Biographical details for players come from the NHL’s player bio data
- We projected contracts for 406 free agents this summer. 100 of those remain unsigned: 35 RFAs and 65 UFAs.
- 10 of these unsigned projections are over $2M per year, with at least a few unlikely to sign a contract for the coming season (Joe Pavelski, Mark Giordano)
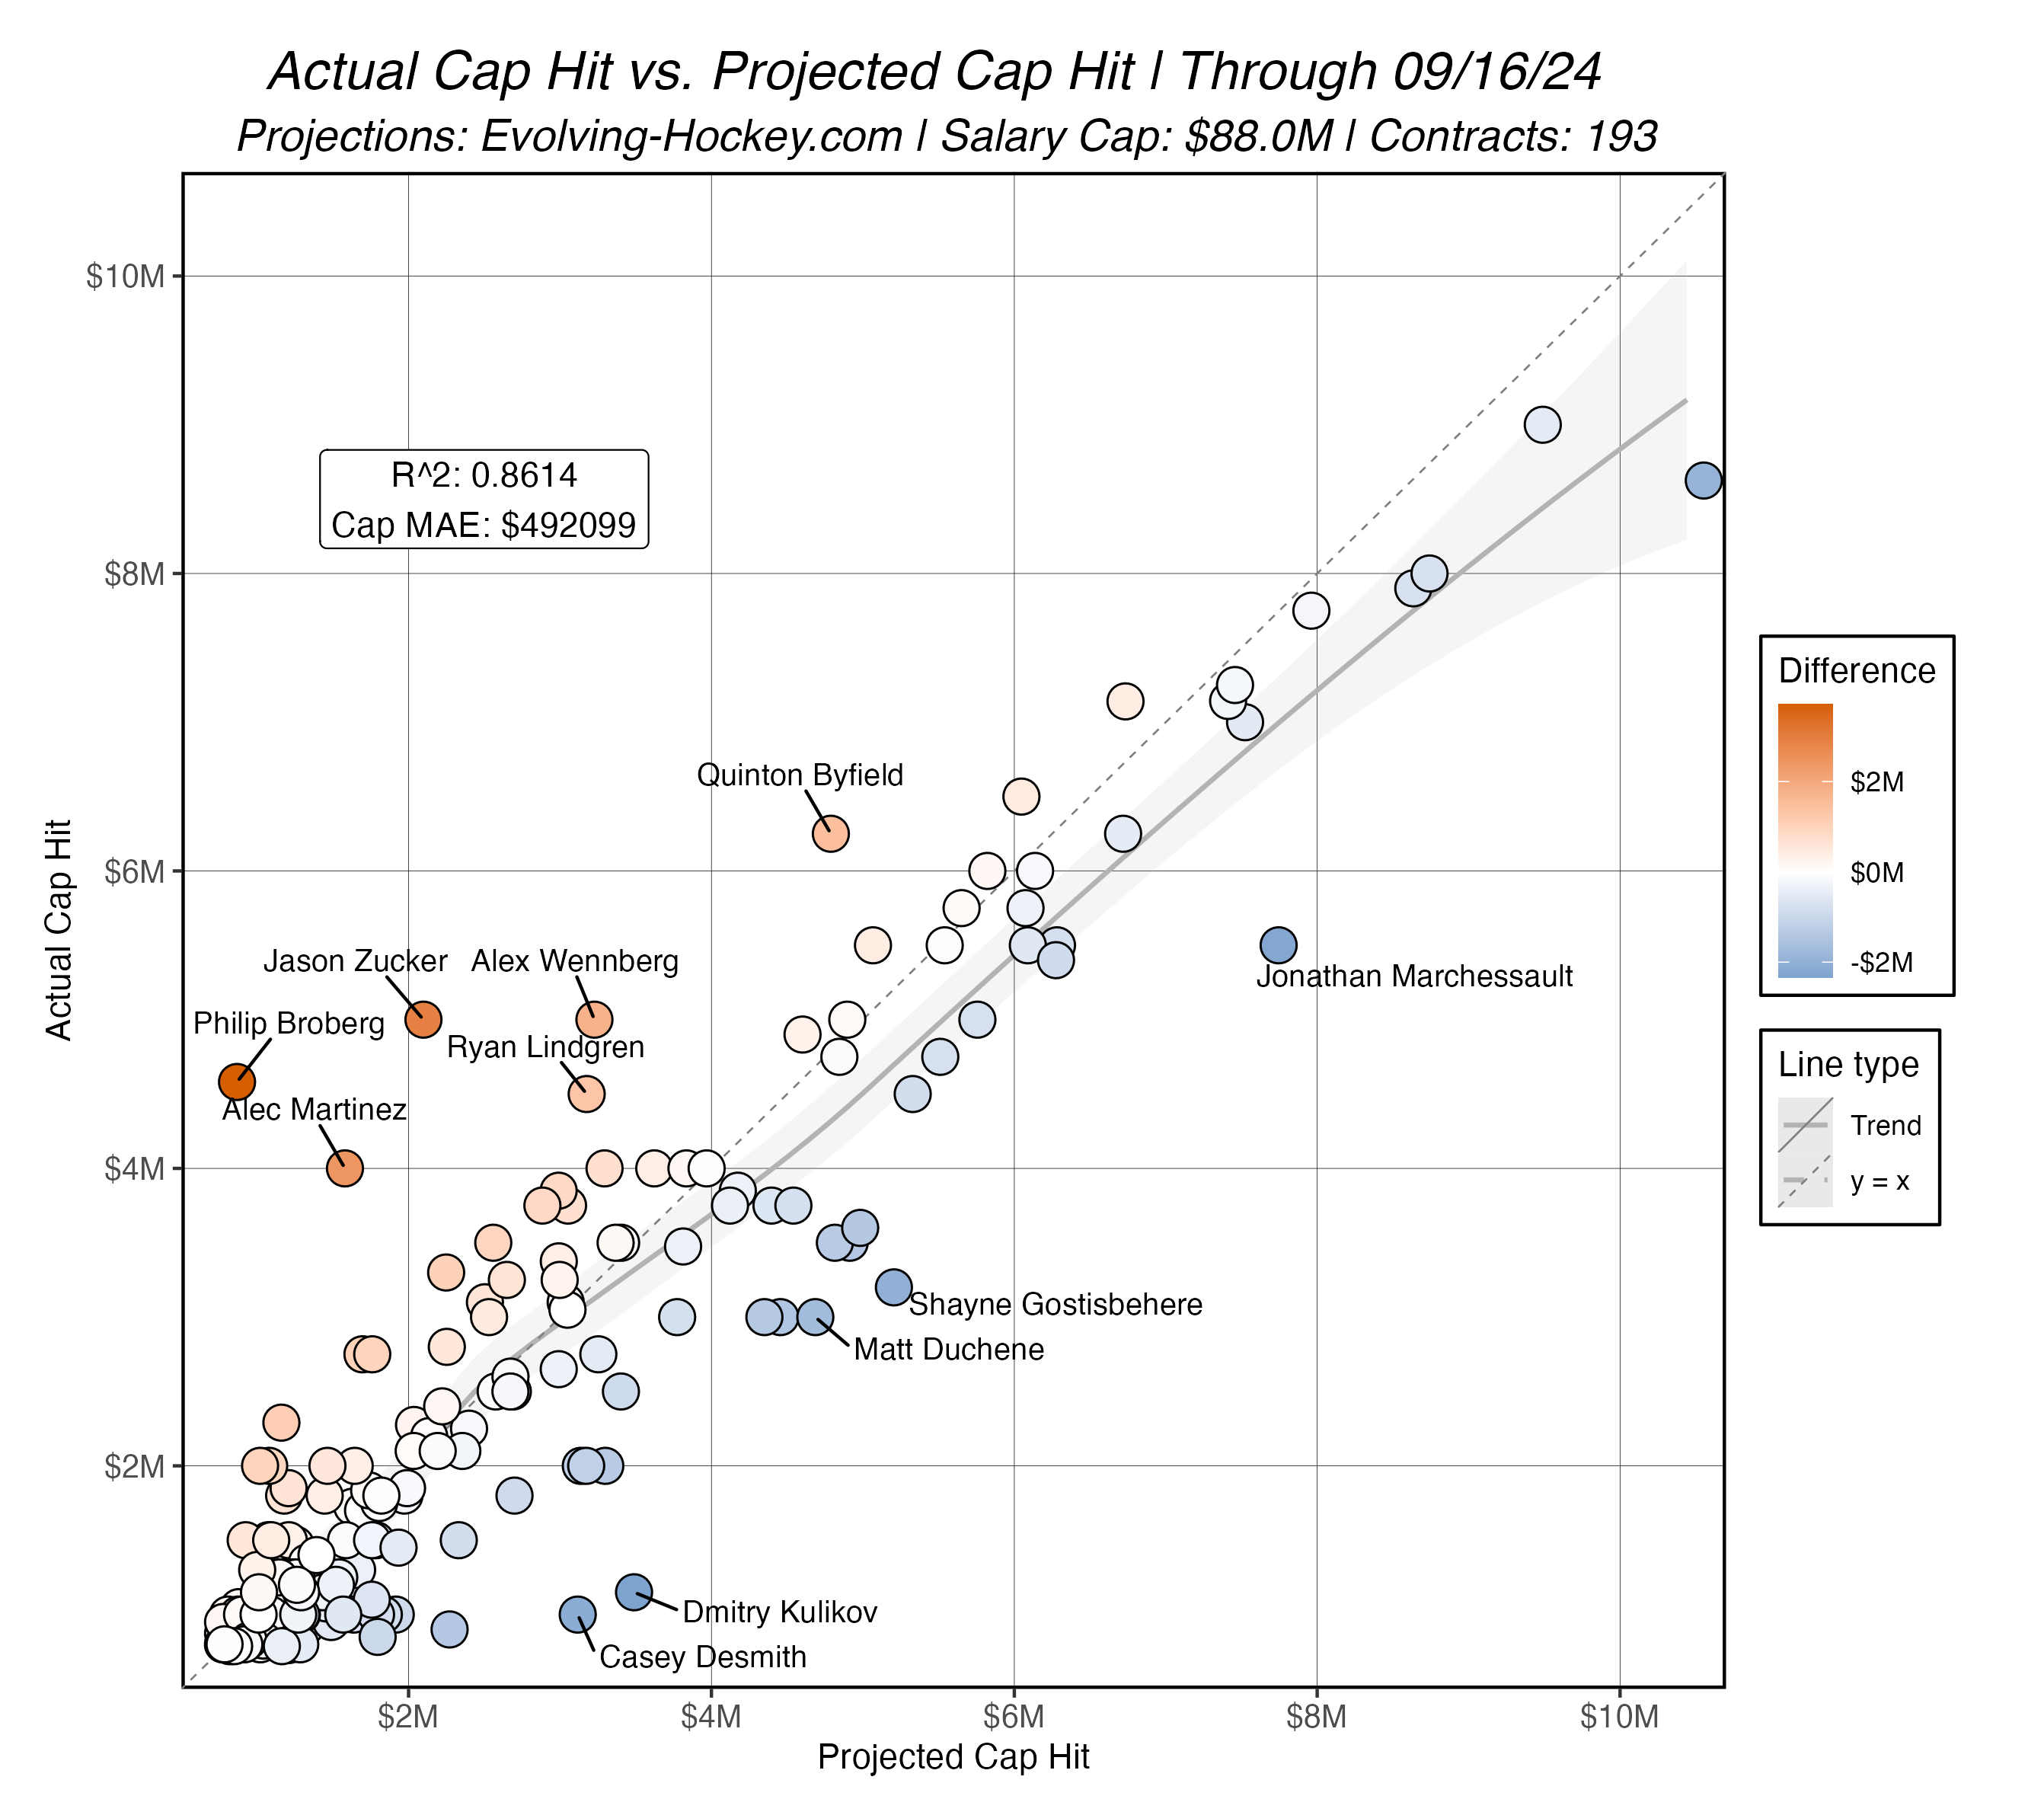
- A total of 193 contracts are included in evaluation
Evaluation
First, let’s look at the timeline for contracts signed. The big talking point this offseason was July 1, and let me tell you, we felt it. There were 99 contracts signed among players we projected, compared with a little over 80 last season. While this number is a bit higher, historically the vast majority of contracts are signed within the first week of Free Agency in any given summer, so this isn’t too surprising.
Here is the “main” chart in our analysis: the actual cap hit of all contracts signed vs. the projected cap hit from our model. As we’ve discussed previously, we’re using the corresponding “actual” term for each contract’s projected $ value. R2 and Mean Absolute Error (MAE) values are displayed along with the x=y line and a general loess regression line (local regression) to show the trend.
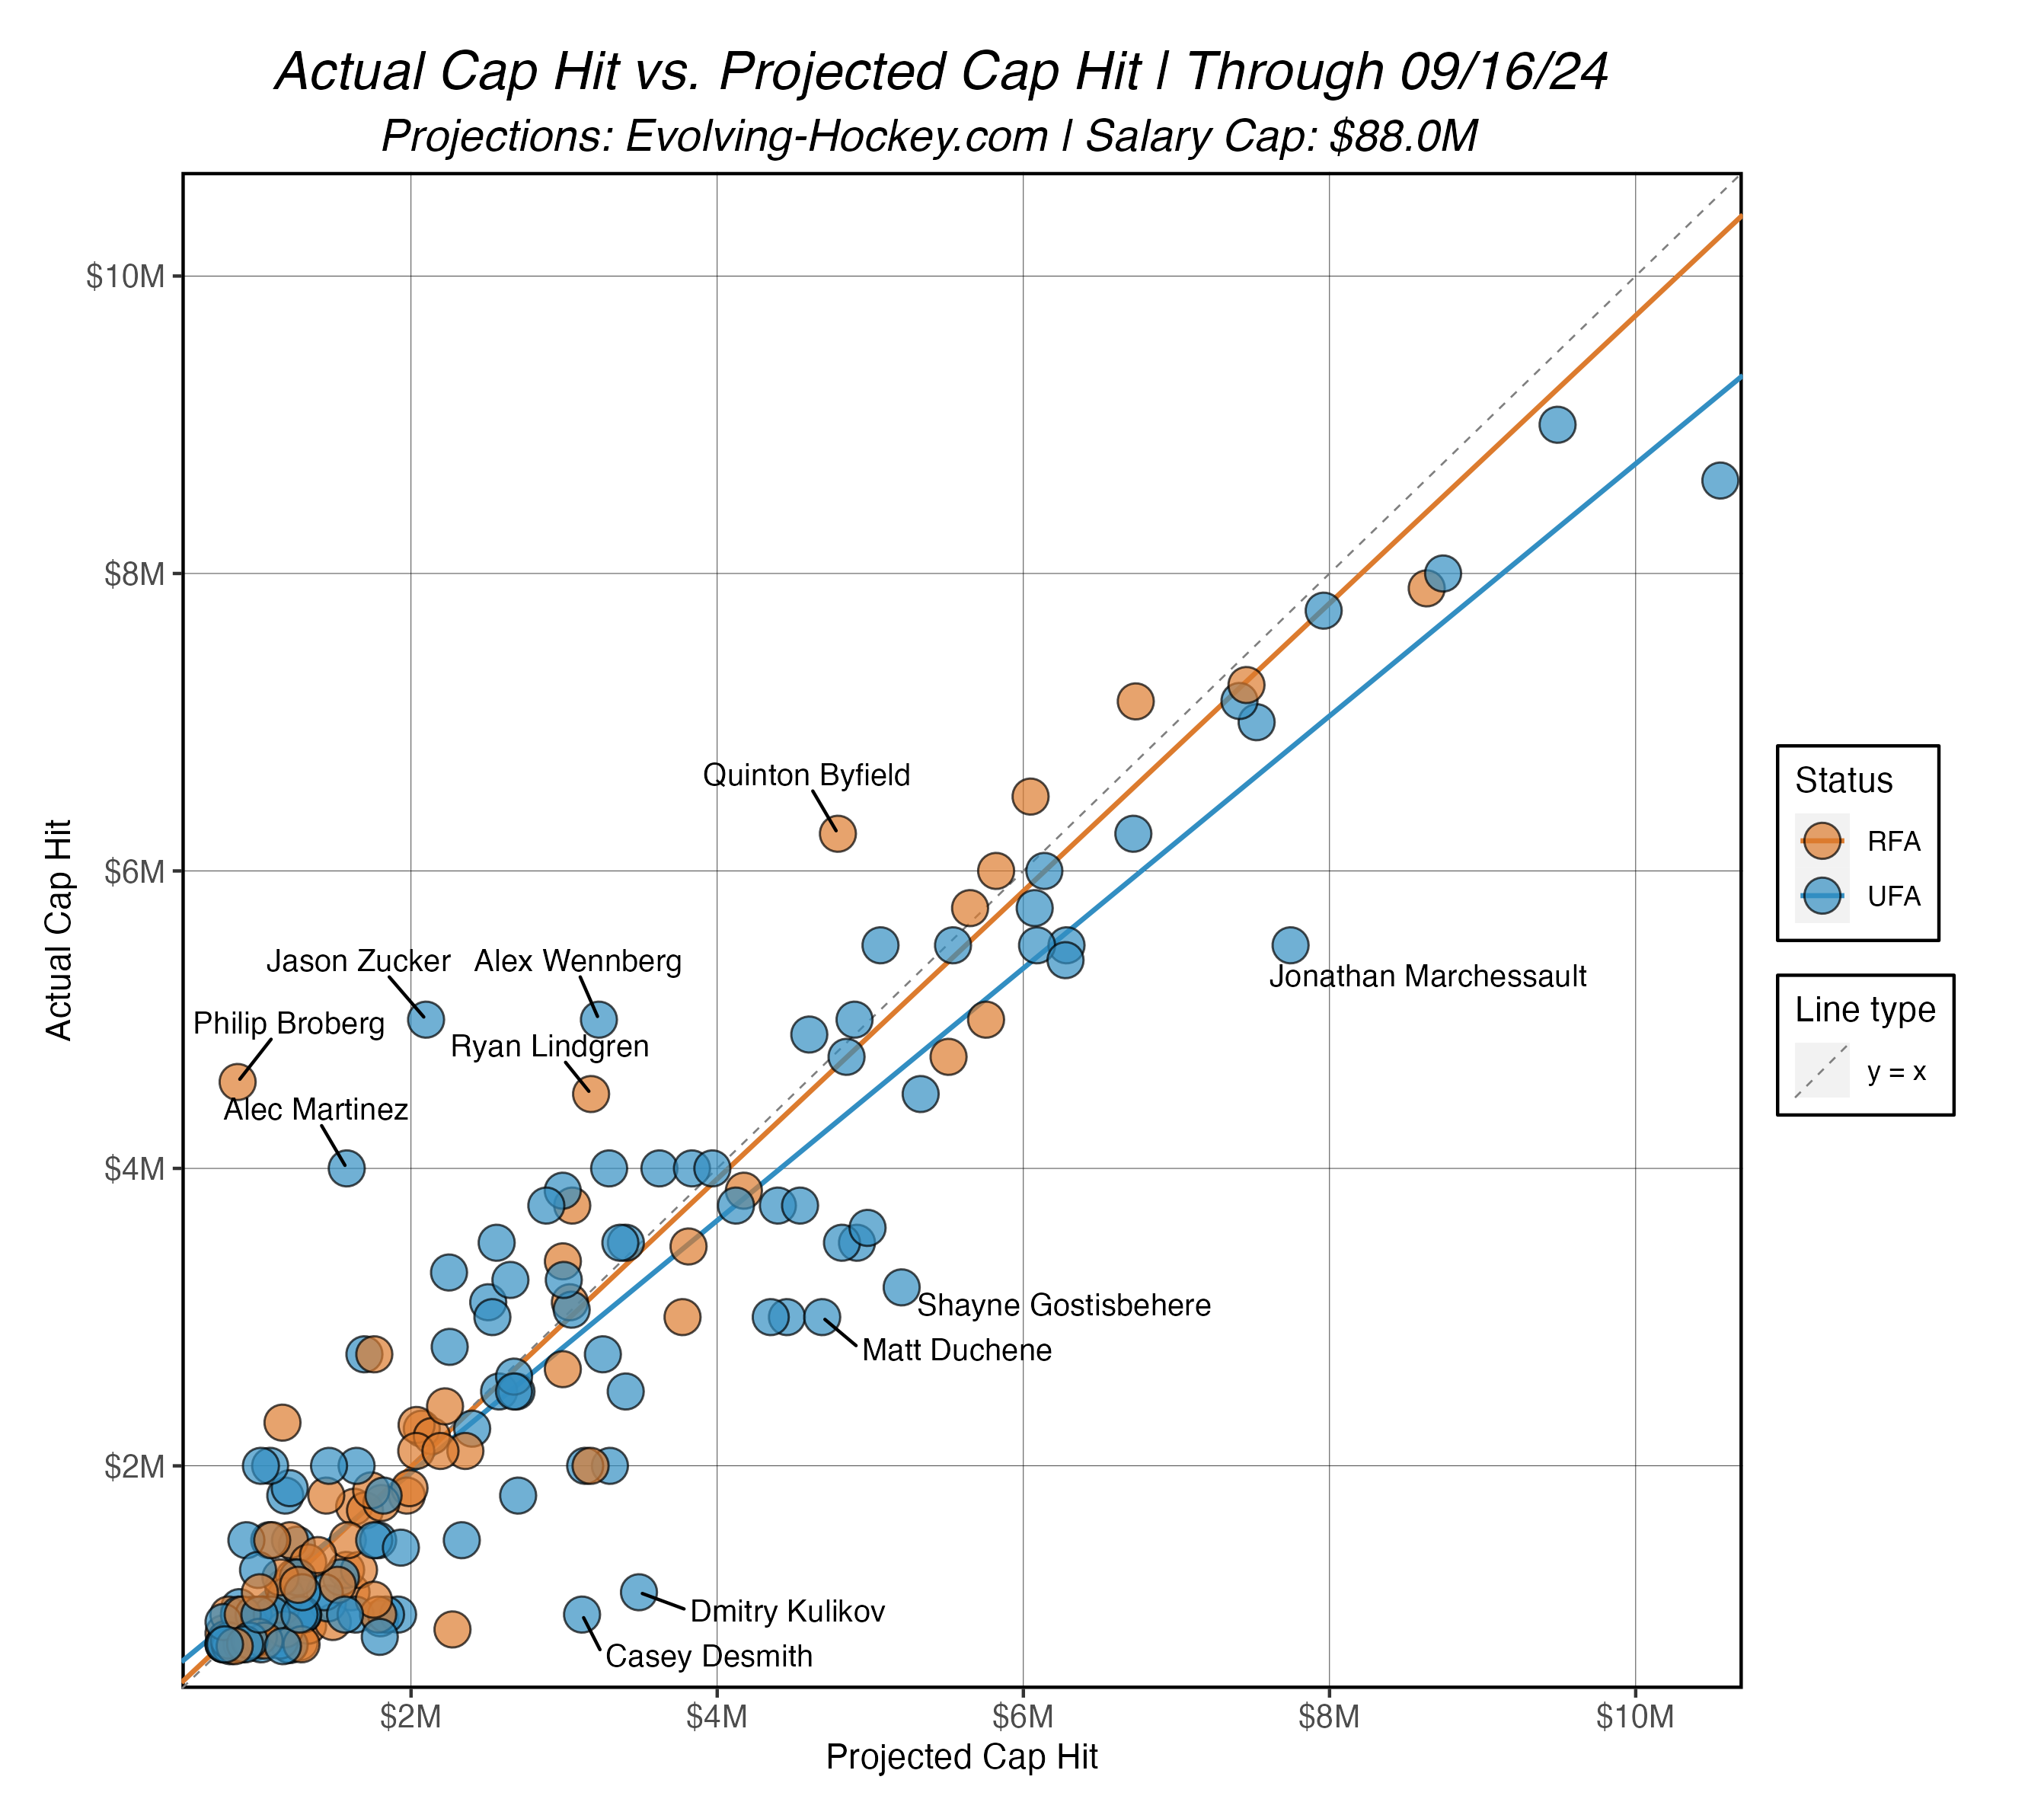
This is the same comparison showing the UFA/RFA split along with corresponding trend lines for each class.
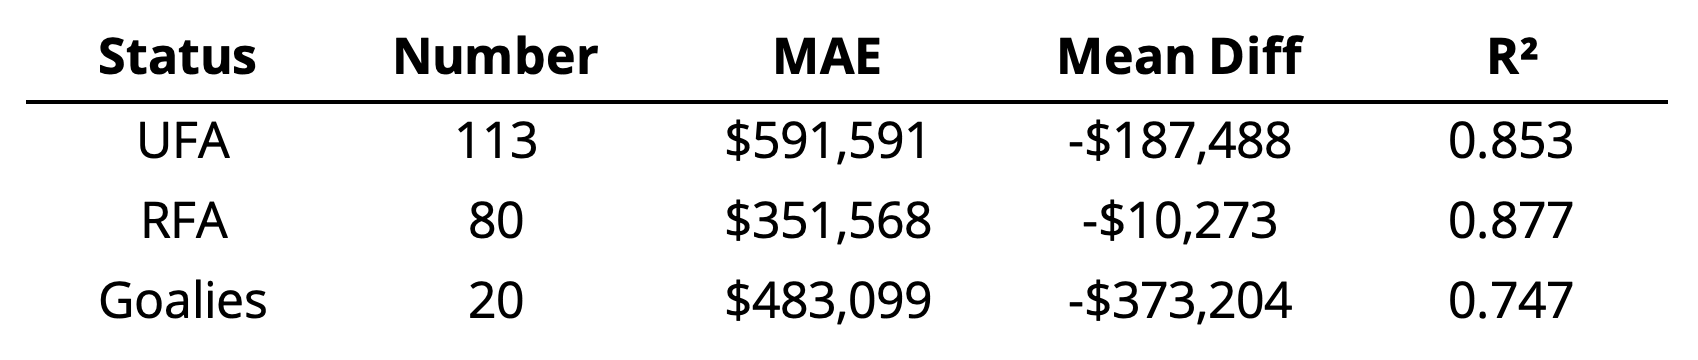
The same evaluation for the more table-oriented readers:
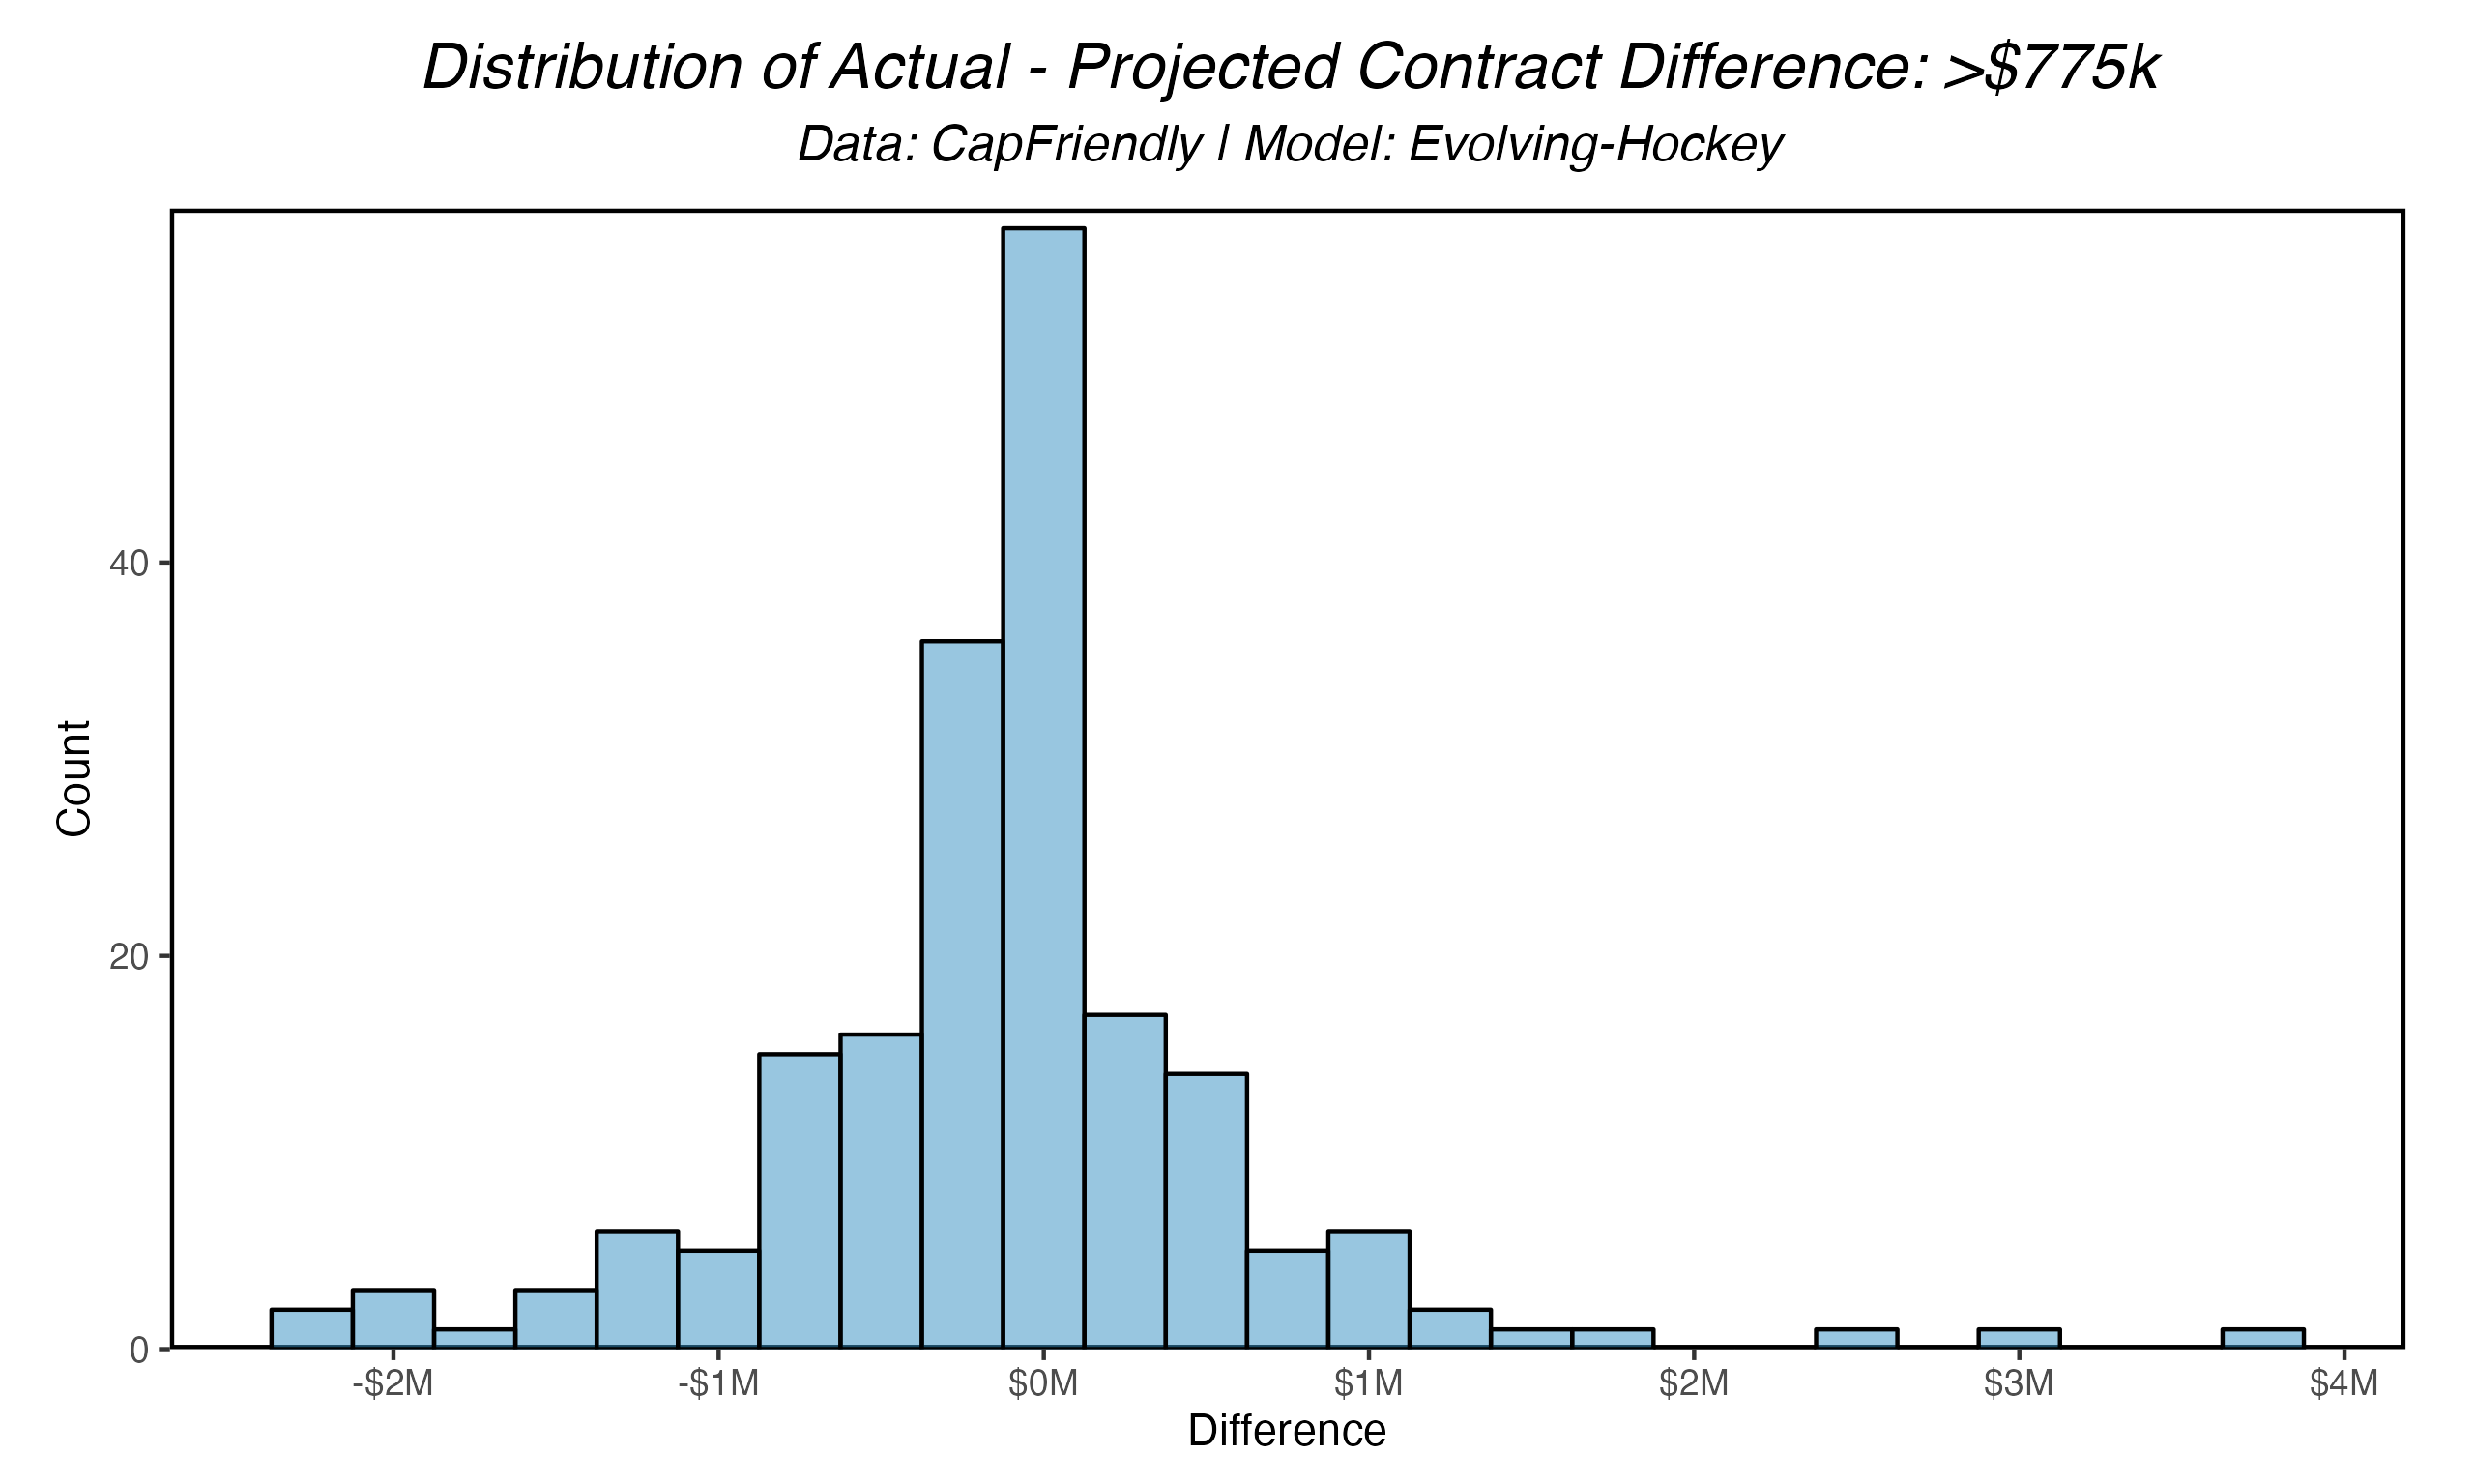
And finally, the distribution of actual – projected contact differences:
Alright, while I let you digest all that, let’s cover a few high-level points. Number one and most importantly: the model performed quite well this summer (I get to say this with emphasis right now because last year was the worst year we’ve seen from the model… let me have this one). As I noted last summer, the NHL entered the 2023 offseason with a looming salary cap increase, and, among a host of other factors, contracts got a little wonky (Dmitry Orlov, Corey Perry, Nick Foligno). While the dust is probably still settling and some RFAs are still swirling around in it, the knowledge of a new $88M salary cap seems to have given teams much more confidence when spending on their targets this summer.
Overall, we see a consistent trend in the model’s calibration: on average, contracts signed below $4M were right in line with expectation while contracts signed over this amount were below expectation. The discrepancy in high-$ contracts isn’t necessarily unique, but the way this discrepancy departed is. We’ve discussed this in our past Free Agency Reviews, but contracts signed and/or projected over ~$4M (depending on the salary cap) are difficult to predict. The reason for this is due to a phenomenon known as “Heteroskedasticity” (explanation), which really is just an incredible word. Basically: as expected contract values increase, the variability of the actual contracts signed also increases. Typically, our contract projection model has had a difficult time projecting contracts high enough in this range (usually they’re under-predicted, but this year, the vast majority of these deals were signed below expectation). Now mind you, we’re not talking about much here, and just like any year this could be an anomaly, but it’s something I’ll definitely be keeping in mind as I re-train the model for next summer’s free agency class in this new salary cap era.
Unlike last year, where UFAs absolutely tanked the model and RFAs were our saving grace, both groups were very close to one another in their overall correlation with expectations. Interestingly, the mean difference for RFAs was within ~$10k, which is entirely a result of the lower variance in circumstance. This isn’t necessarily surprising: RFAs have less bargaining power given their signing decision is out of their control. The two biggest “misses” here were an offer sheet (Broberg), and a great young player with two back and forth years (Byfield). The UFA market calmed down a bit compared to last summer, only providing us with a few variances. From a model standpoint, Dmitry Kulikov’s projected contract may be the most interesting miss. After putting up consistent mid-20 point seasons with four different teams, the model was fairly confident he’d sign a much bigger deal at 4 years, but the Panthers got him dirt cheap. There’s always one UFA we can’t figure out – at least it wasn’t the Giordano deal again.
Team Evaluation
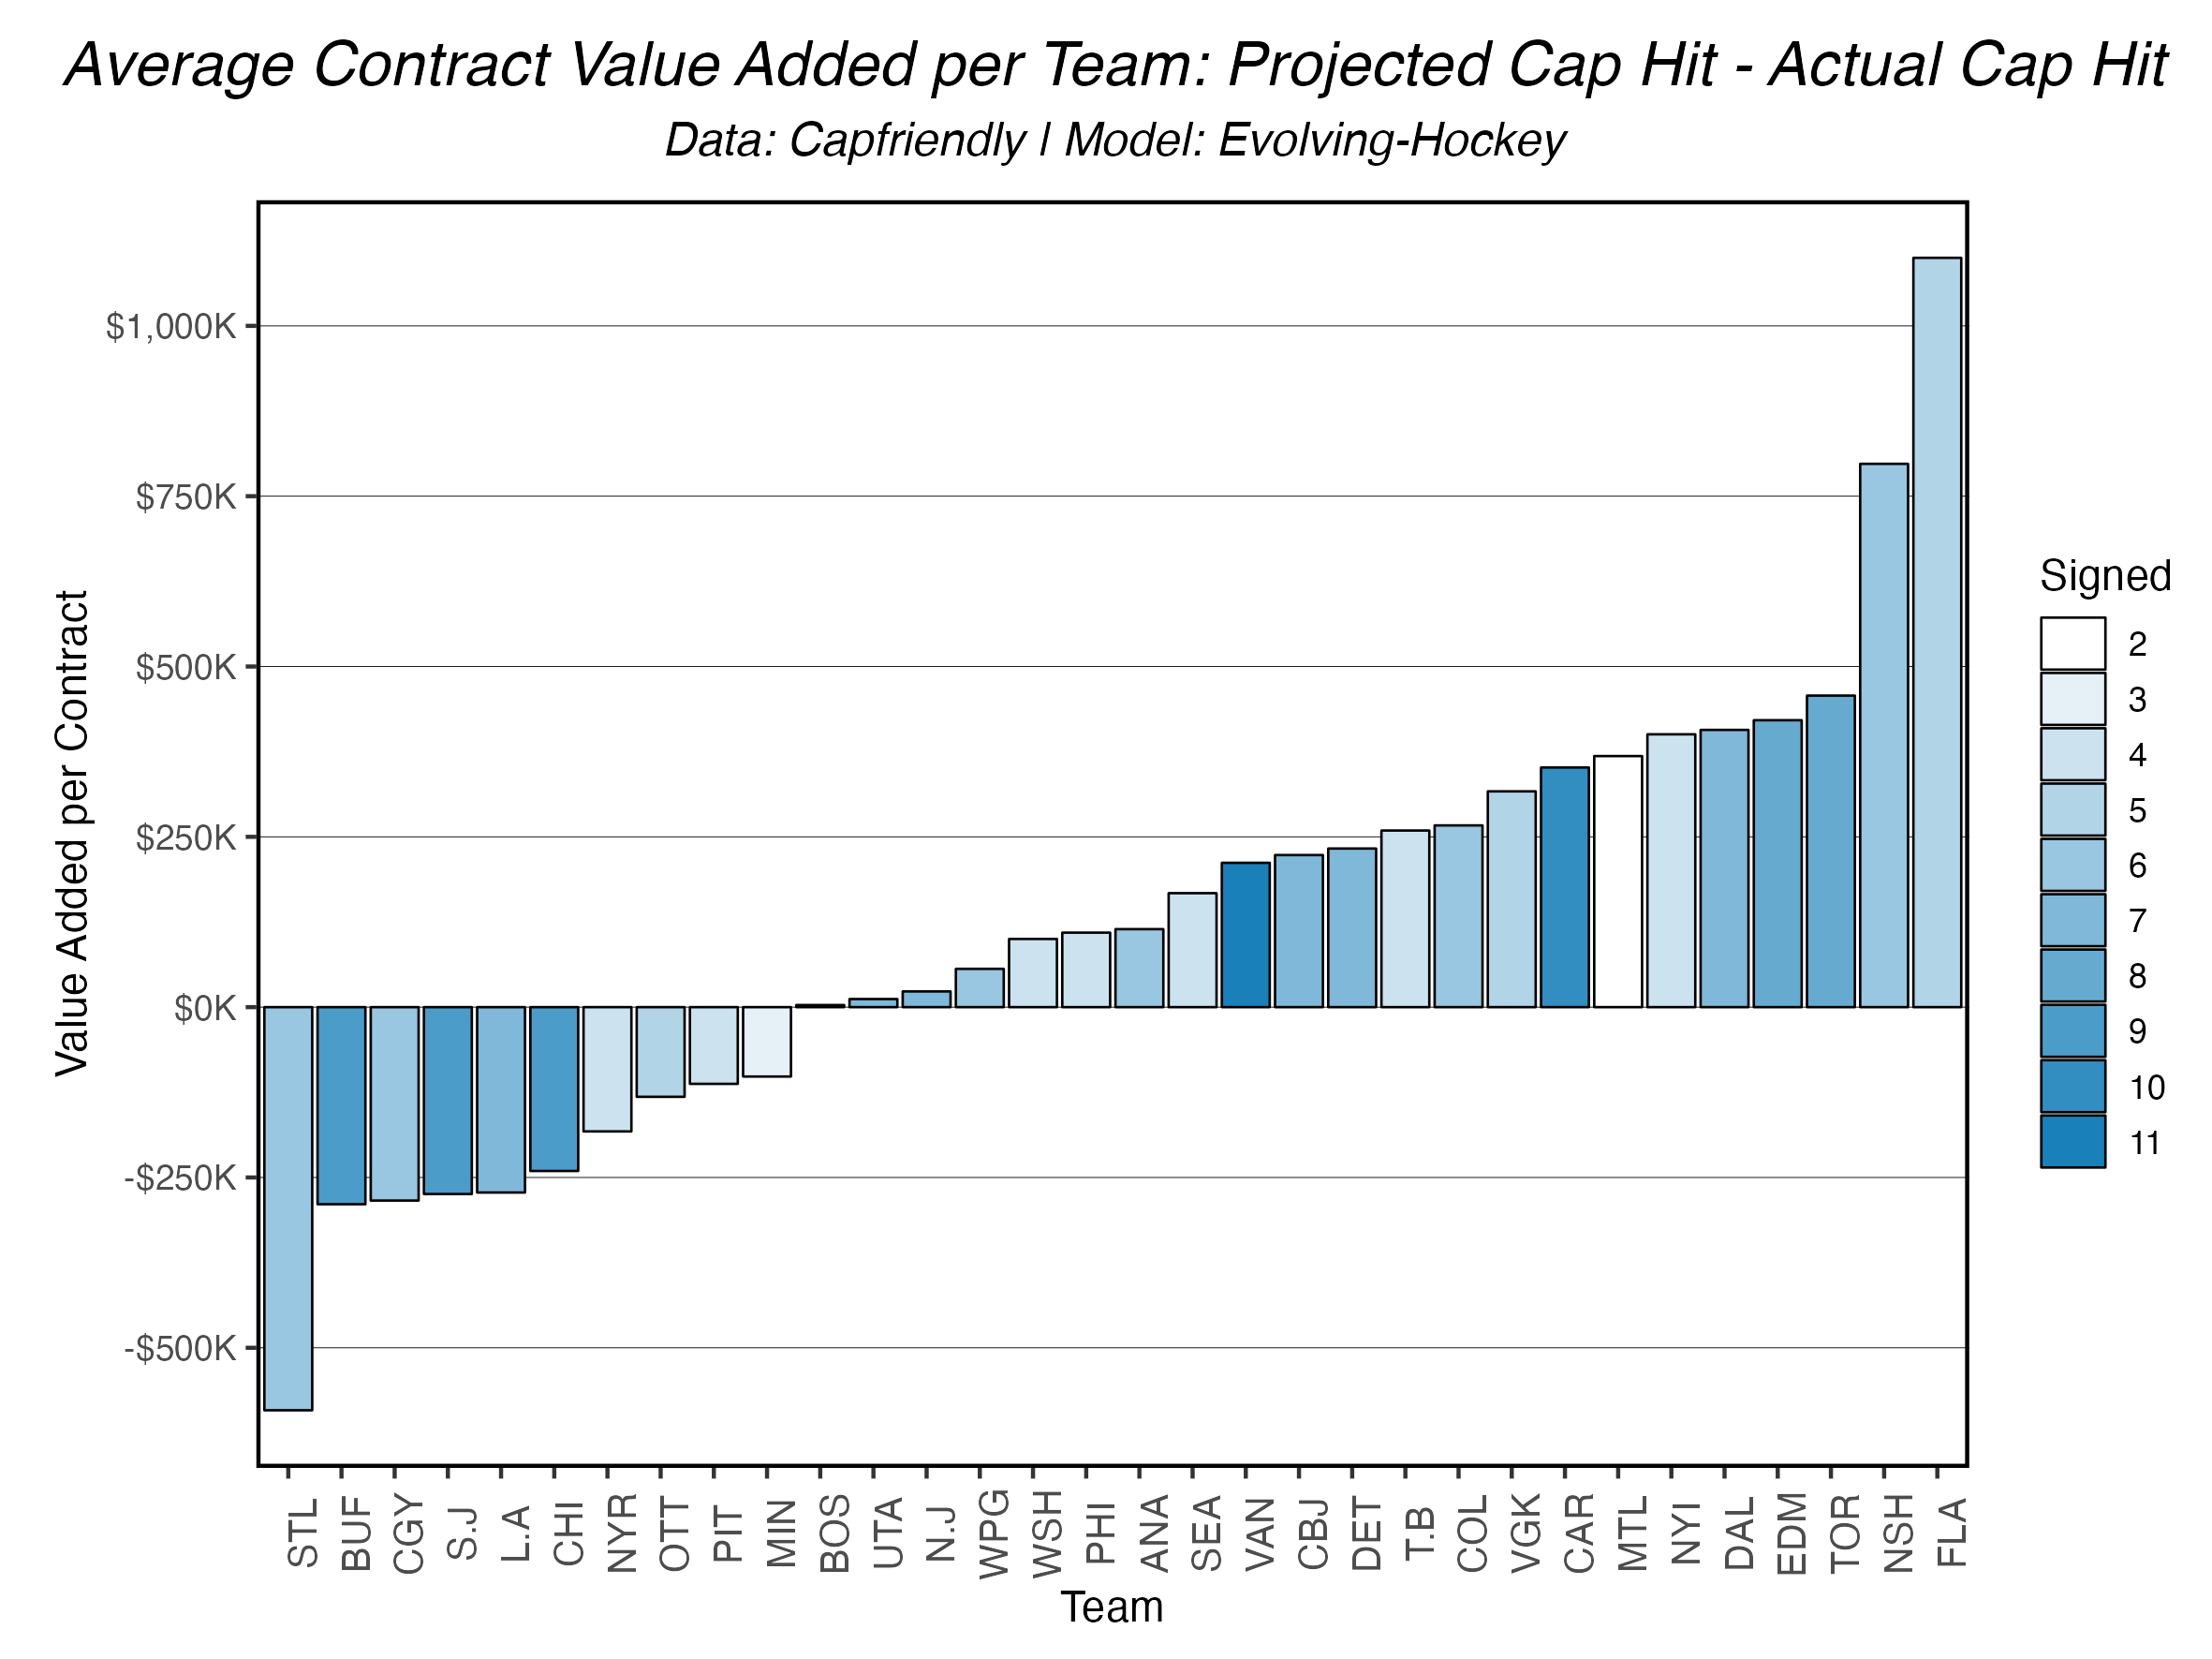
Here we see the average difference in actual vs. projected contracts signed by each team (now including Utah!) For example, Vancouver signed 11 players that we projected contracts for, averaging roughly $200k signed below expectation (more on them below). This also gives us a cursory view of how active teams were this offseason. Keep in mind, some teams only signed a few players, and those few players can have a large impacts on this average – but overall this does a good job of highlighting interesting teams. On to some individual teams.
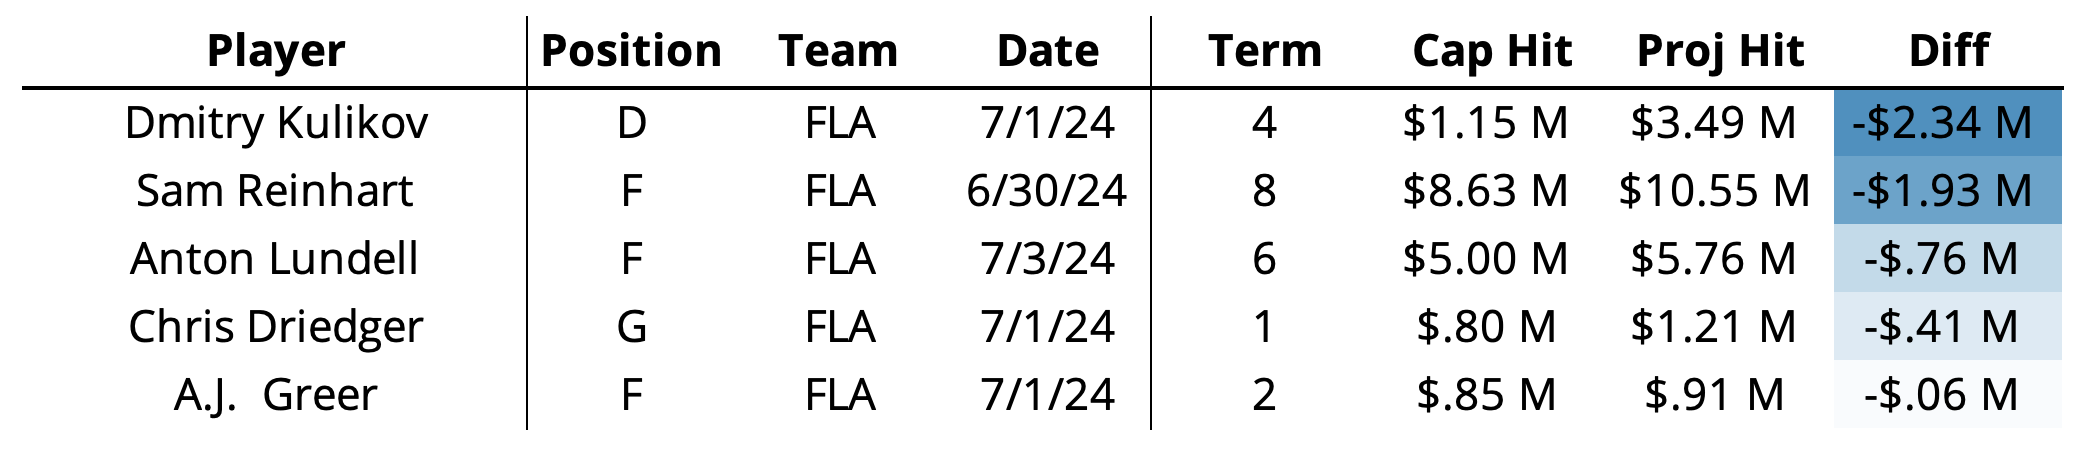
First let’s cover the “winners”. Florida, Nashville, and (almost) Toronto all managed to “beat” our projected contracts for the players they signed. I think it’s fair to say that the Panthers had an objectively good summer. It’s unsurprising that Sam Reinhart would re-sign with them, but getting him locked in for close to $2M under expectation might be one of the best “moves” made by any team. While Anton Lundell hasn’t necessarily been able to recreate his breakout ’21-22 season, securing the promising 22-year-old for 6 more years is a good piece of business for Florida. With the aforementioned Kulikov coming in well below expectation, and the slight but efficient adds of Chris Driedger and A.J. Greer (the all-time NHL player in hockey stats alphabetical sorting), Florida is set up for another fantastic season with little reason to doubt. Unless you hate tax rates and “nice” weather.
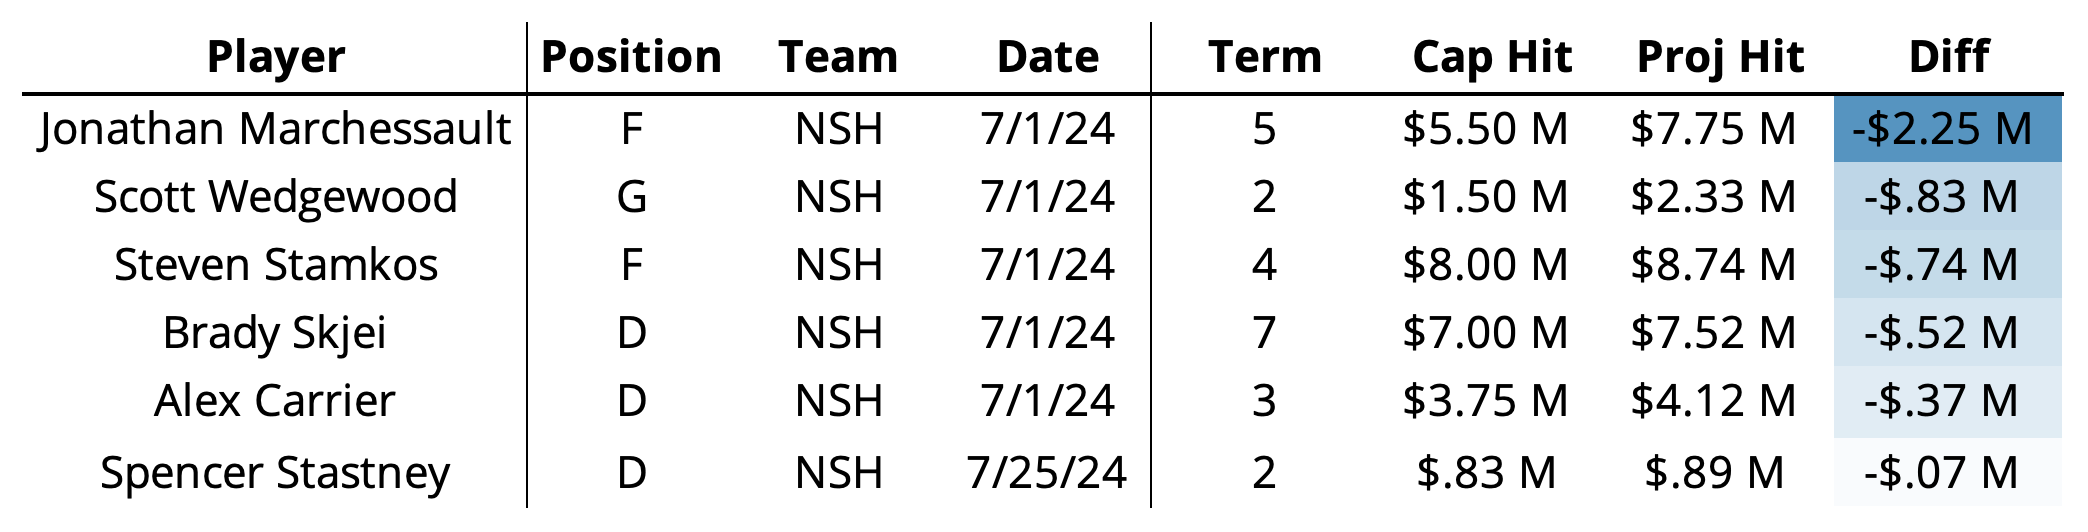
Nashville may have had the most surprising summer of any team. After an unexpected run into the first wild card spot with 99 points in the West, fans may have thought they’d be active this summer, but I’m sure few imagined Steven Stamkos of all players would be heading into ’24-25 season on this team. We were confident he’d fetch a good amount on the open market (just like our model was – that’s just coincidence), and while $8M isn’t cheap, it was a bit under our projected amount at 4 years. Along with Stamkos, the Preds signed one of the best-value deals of any team in Marchessault’s new contract, and they added the consistently good Brady Skjei to fill out their blue line. Only Vancouver and Carolina spent more money on players this summer, but I’d argue Nashville was the more efficient big-spender overall.
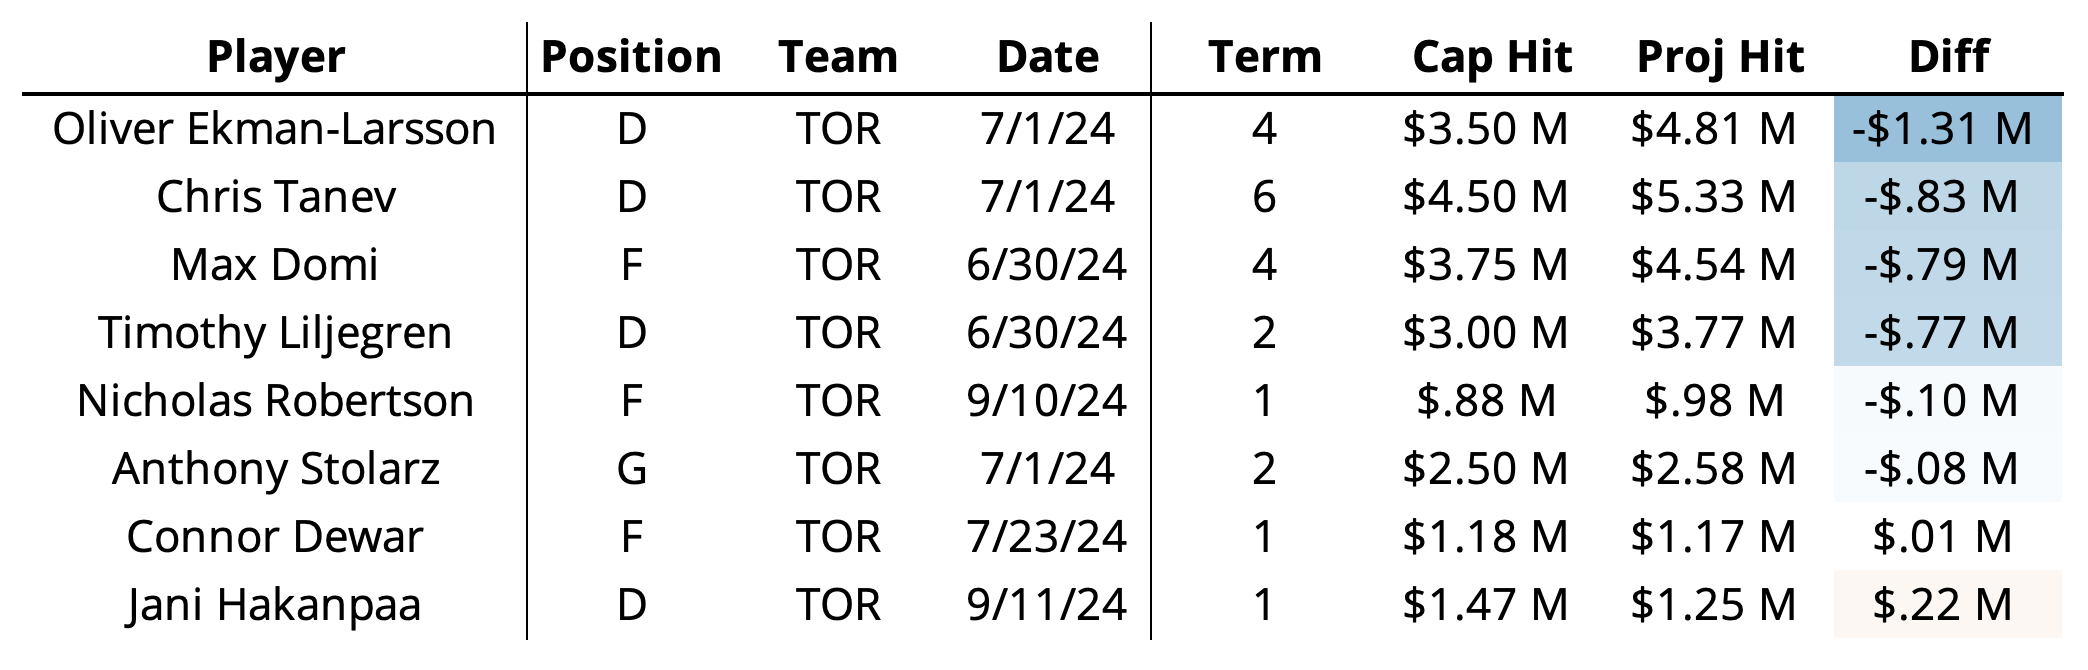
The Maple Leafs are a good example of a team having a “great” offseason from a pure-dollar value standpoint while not quite matching that with the players added. Other than the slight overage with Hakanpää, the Leafs were quite effective with the money they spent compared to expectation, but a team’s long-term UFA additions all being in their 30s with questionable upside brings that effectiveness down a bit. Don’t get me wrong, Tanev is still quite good, and OEL had a very good year with Florida, but investing $8M for the next 4-6 years in both feels a little misguided. That said, we here at Evolving Hockey still love Timothy Liljegren, even on a bridge deal. The Leafs did well to, at the very least, actually save money on their older UFAs, which is actually kind of impressive given the track record of basically every team in the NHL when it comes to these contracts, so we can at least give them credit for that.
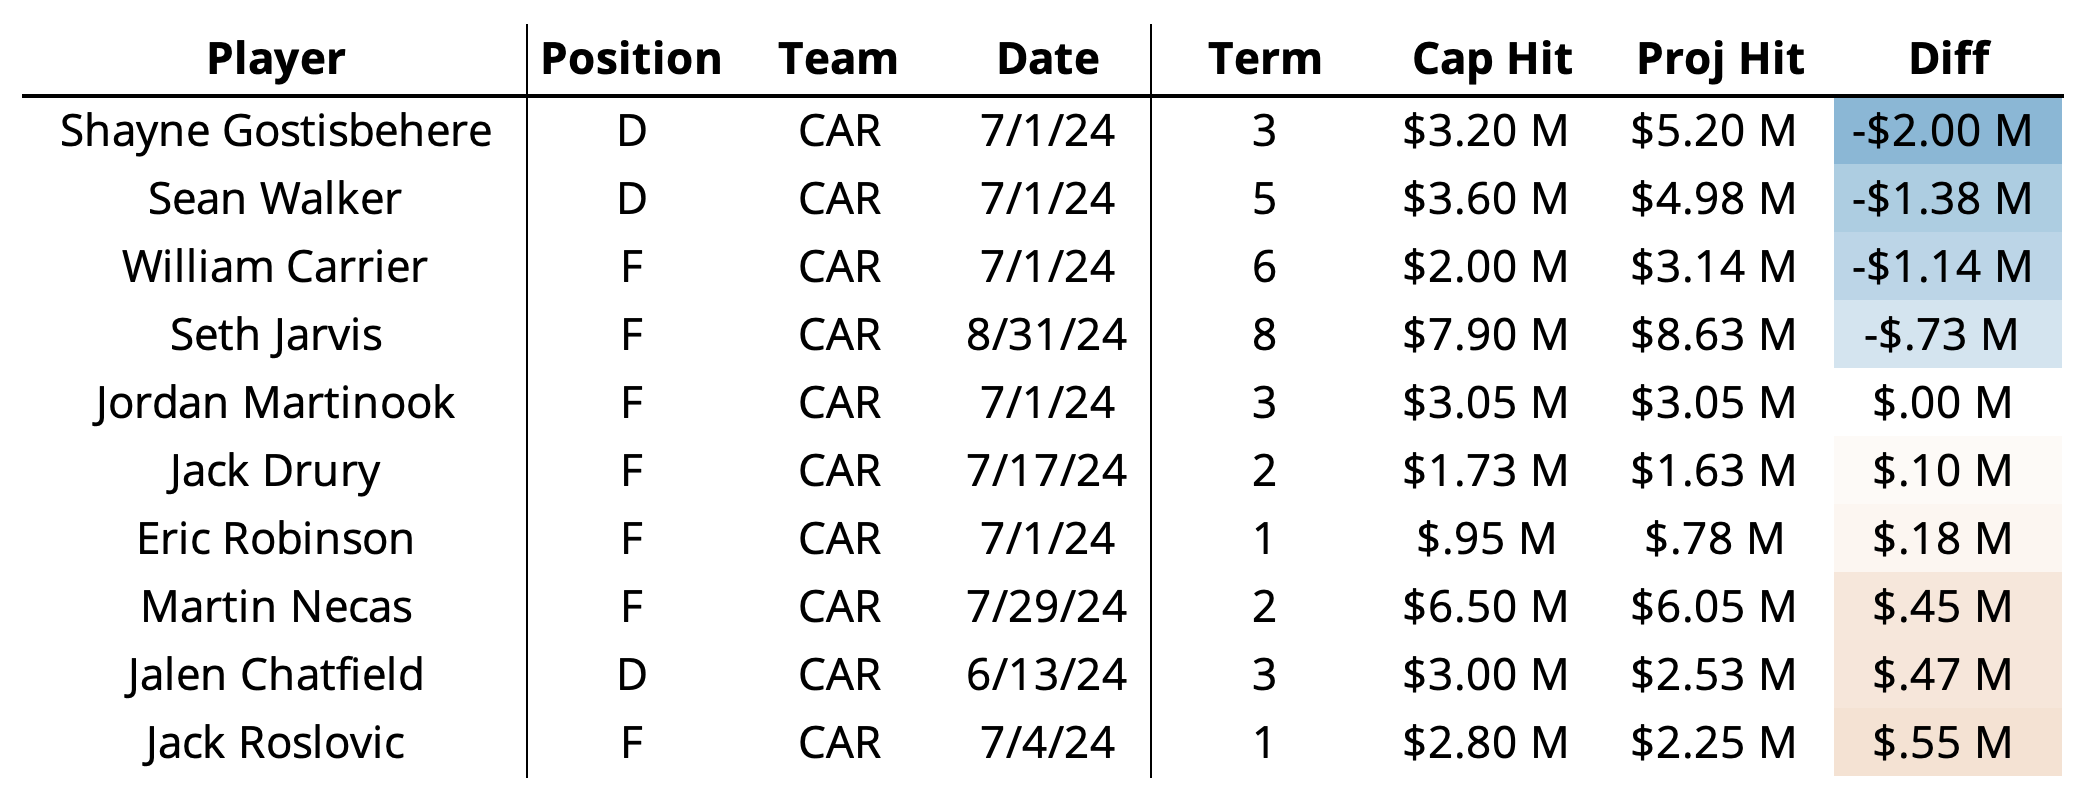
Now on two of the most active teams in the league this summer (Vancouver below). We projected 15 total contracts for players who finished last season with the Hurricanes, which is more than I can remember seeing since we’ve been maintaining this model (don’t quote me on that, I didn’t actually look up the max number): the Canes were going to have a summer regardless. With two high-end RFAs up for new contracts (Jarvis and Necas) along with numerous UFAs to consider, Carolina navigated their summer well. I have to assume their new GM, who might have written articles about hockey statistics a decade ago that were very informative and helpful for me personally, had a lot to do with their smooth sailing. It’s no surprise to anyone at this point that Gostisbehere was going to be undervalued here; even if it is just a contract – I’m not sure there’s ever been a time where Ghost wasn’t among our most undervalued or overlooked or whatever players in any kind of evaluation. The additions of Sean Walker (who was also among our best-value UFAs in our preview a few months ago) and the re-signings of Jarvis and Drury along with spot-on expectations for Martinook round out a very impressive summer for the Hurricanes.
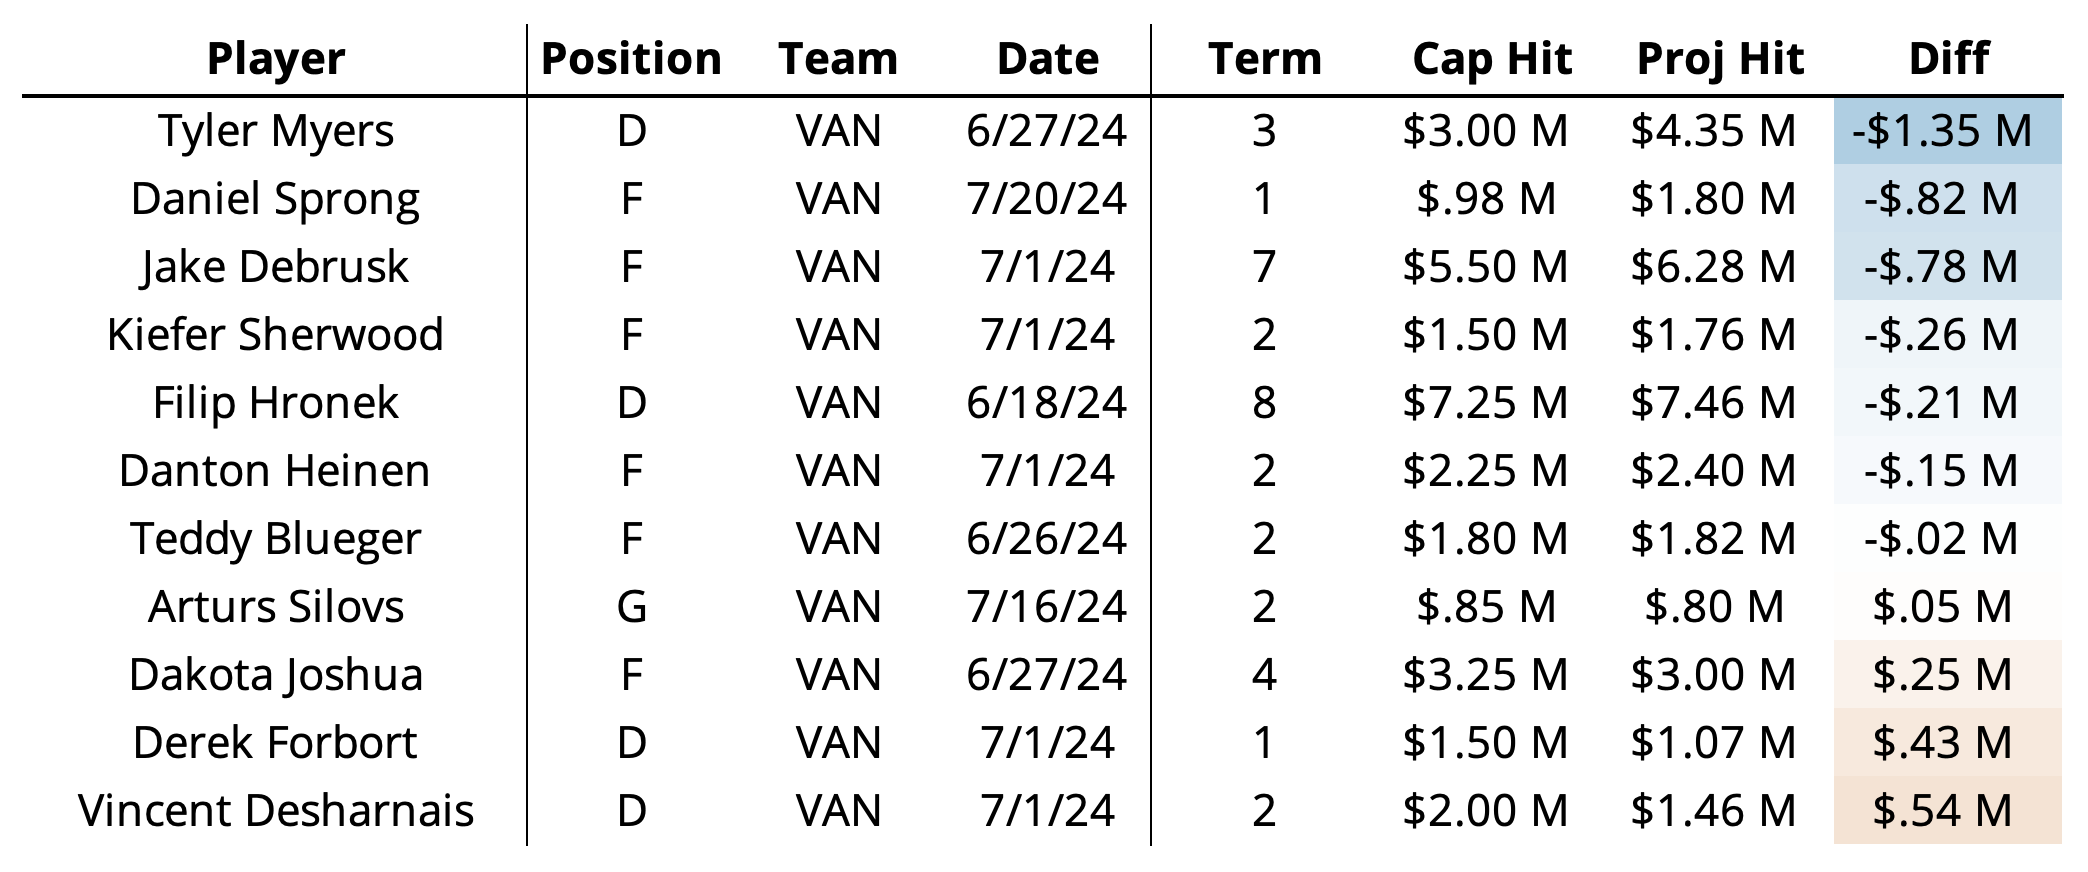
Ah the Canucks, what a team eh? Like the Canes, they did a lot. Admittedly, they weren’t working with the same kind of RFA selection that Carolina was heading into this summer, but they still managed to stay slightly below our projected total among their 11 additions here. Tyler Myers may be the most interesting player among these because while he is empirically not a good player from almost any modeling perspective, he is the kind of player that GMs have historically paid a decent amount of money for. The Canucks managed to not pay that much for him (although it was still too much). The Hronek deal is another interesting one – right in line with our quite high projection, he enters ’24-25 with an unimpressive last season from an underlying metrics standpoint under his belt. Given he’s Quinn Hughes’ counterpart, there isn’t anything unusual about any of this, but it’s something to note. Easily the player with the most upside here is Jake DeBrusk, who is only two seasons removed from a 22 xGAR performance. Shawn will miss him.
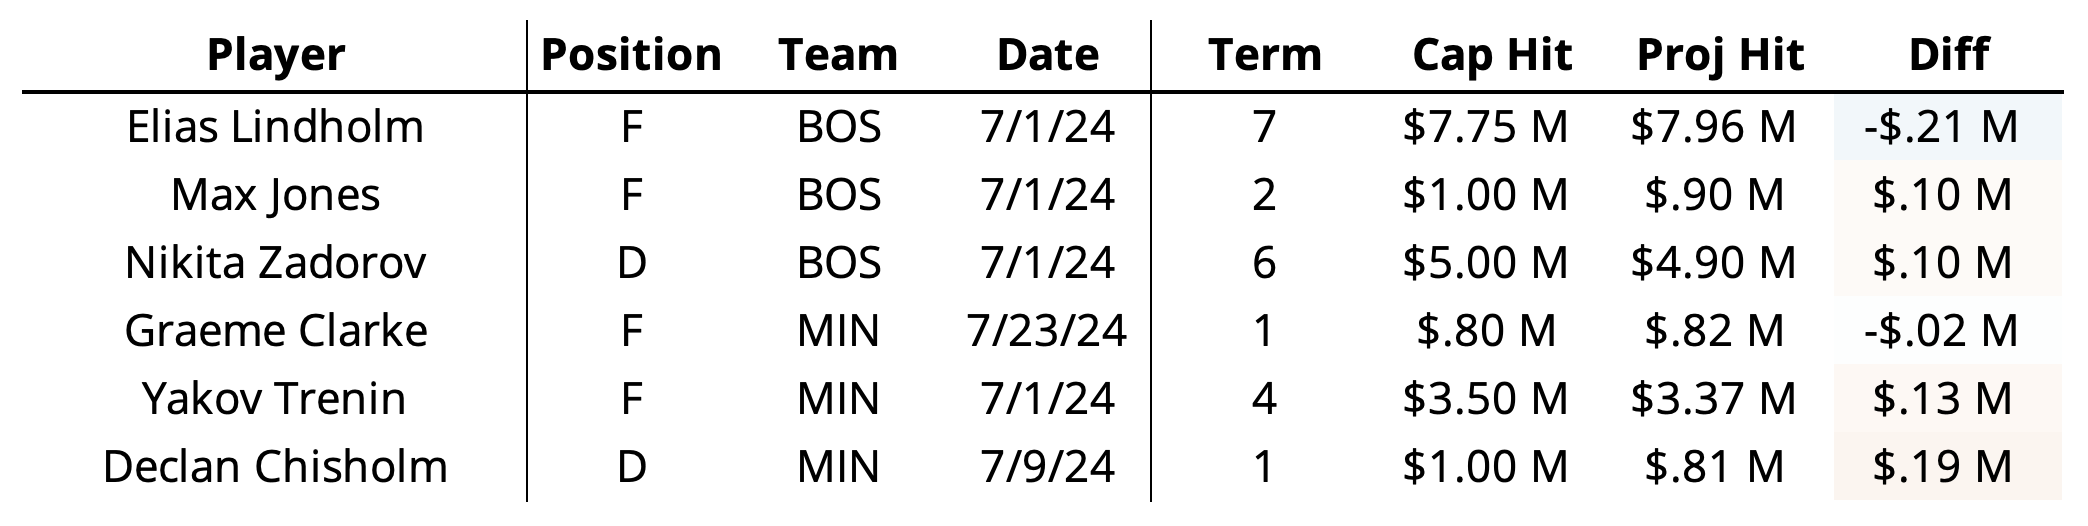
Finally, the team that helped the model the most! The Minnesota Bruins. Each year I like to highlight the team that signed contracts closest to our projection, and this year it’s really two teams who each signed three players who we projected contracts for. Interestingly, these contracts consist of more than just 1-2 year deals. Given these were all right in line with expectation, there’s not much for me to say (we already talked about Lindholm in our preview so I’ll just let that speak for me here). We would just like to say thank you to Minnesota and Boston for helping our model out the most! Your check is in the mail.
Player Evaluation
Enough money talk. It’s time to smush some models together and see what happens. Here is our now standard attempt to compare contract value to expected Goals Above Replacement.
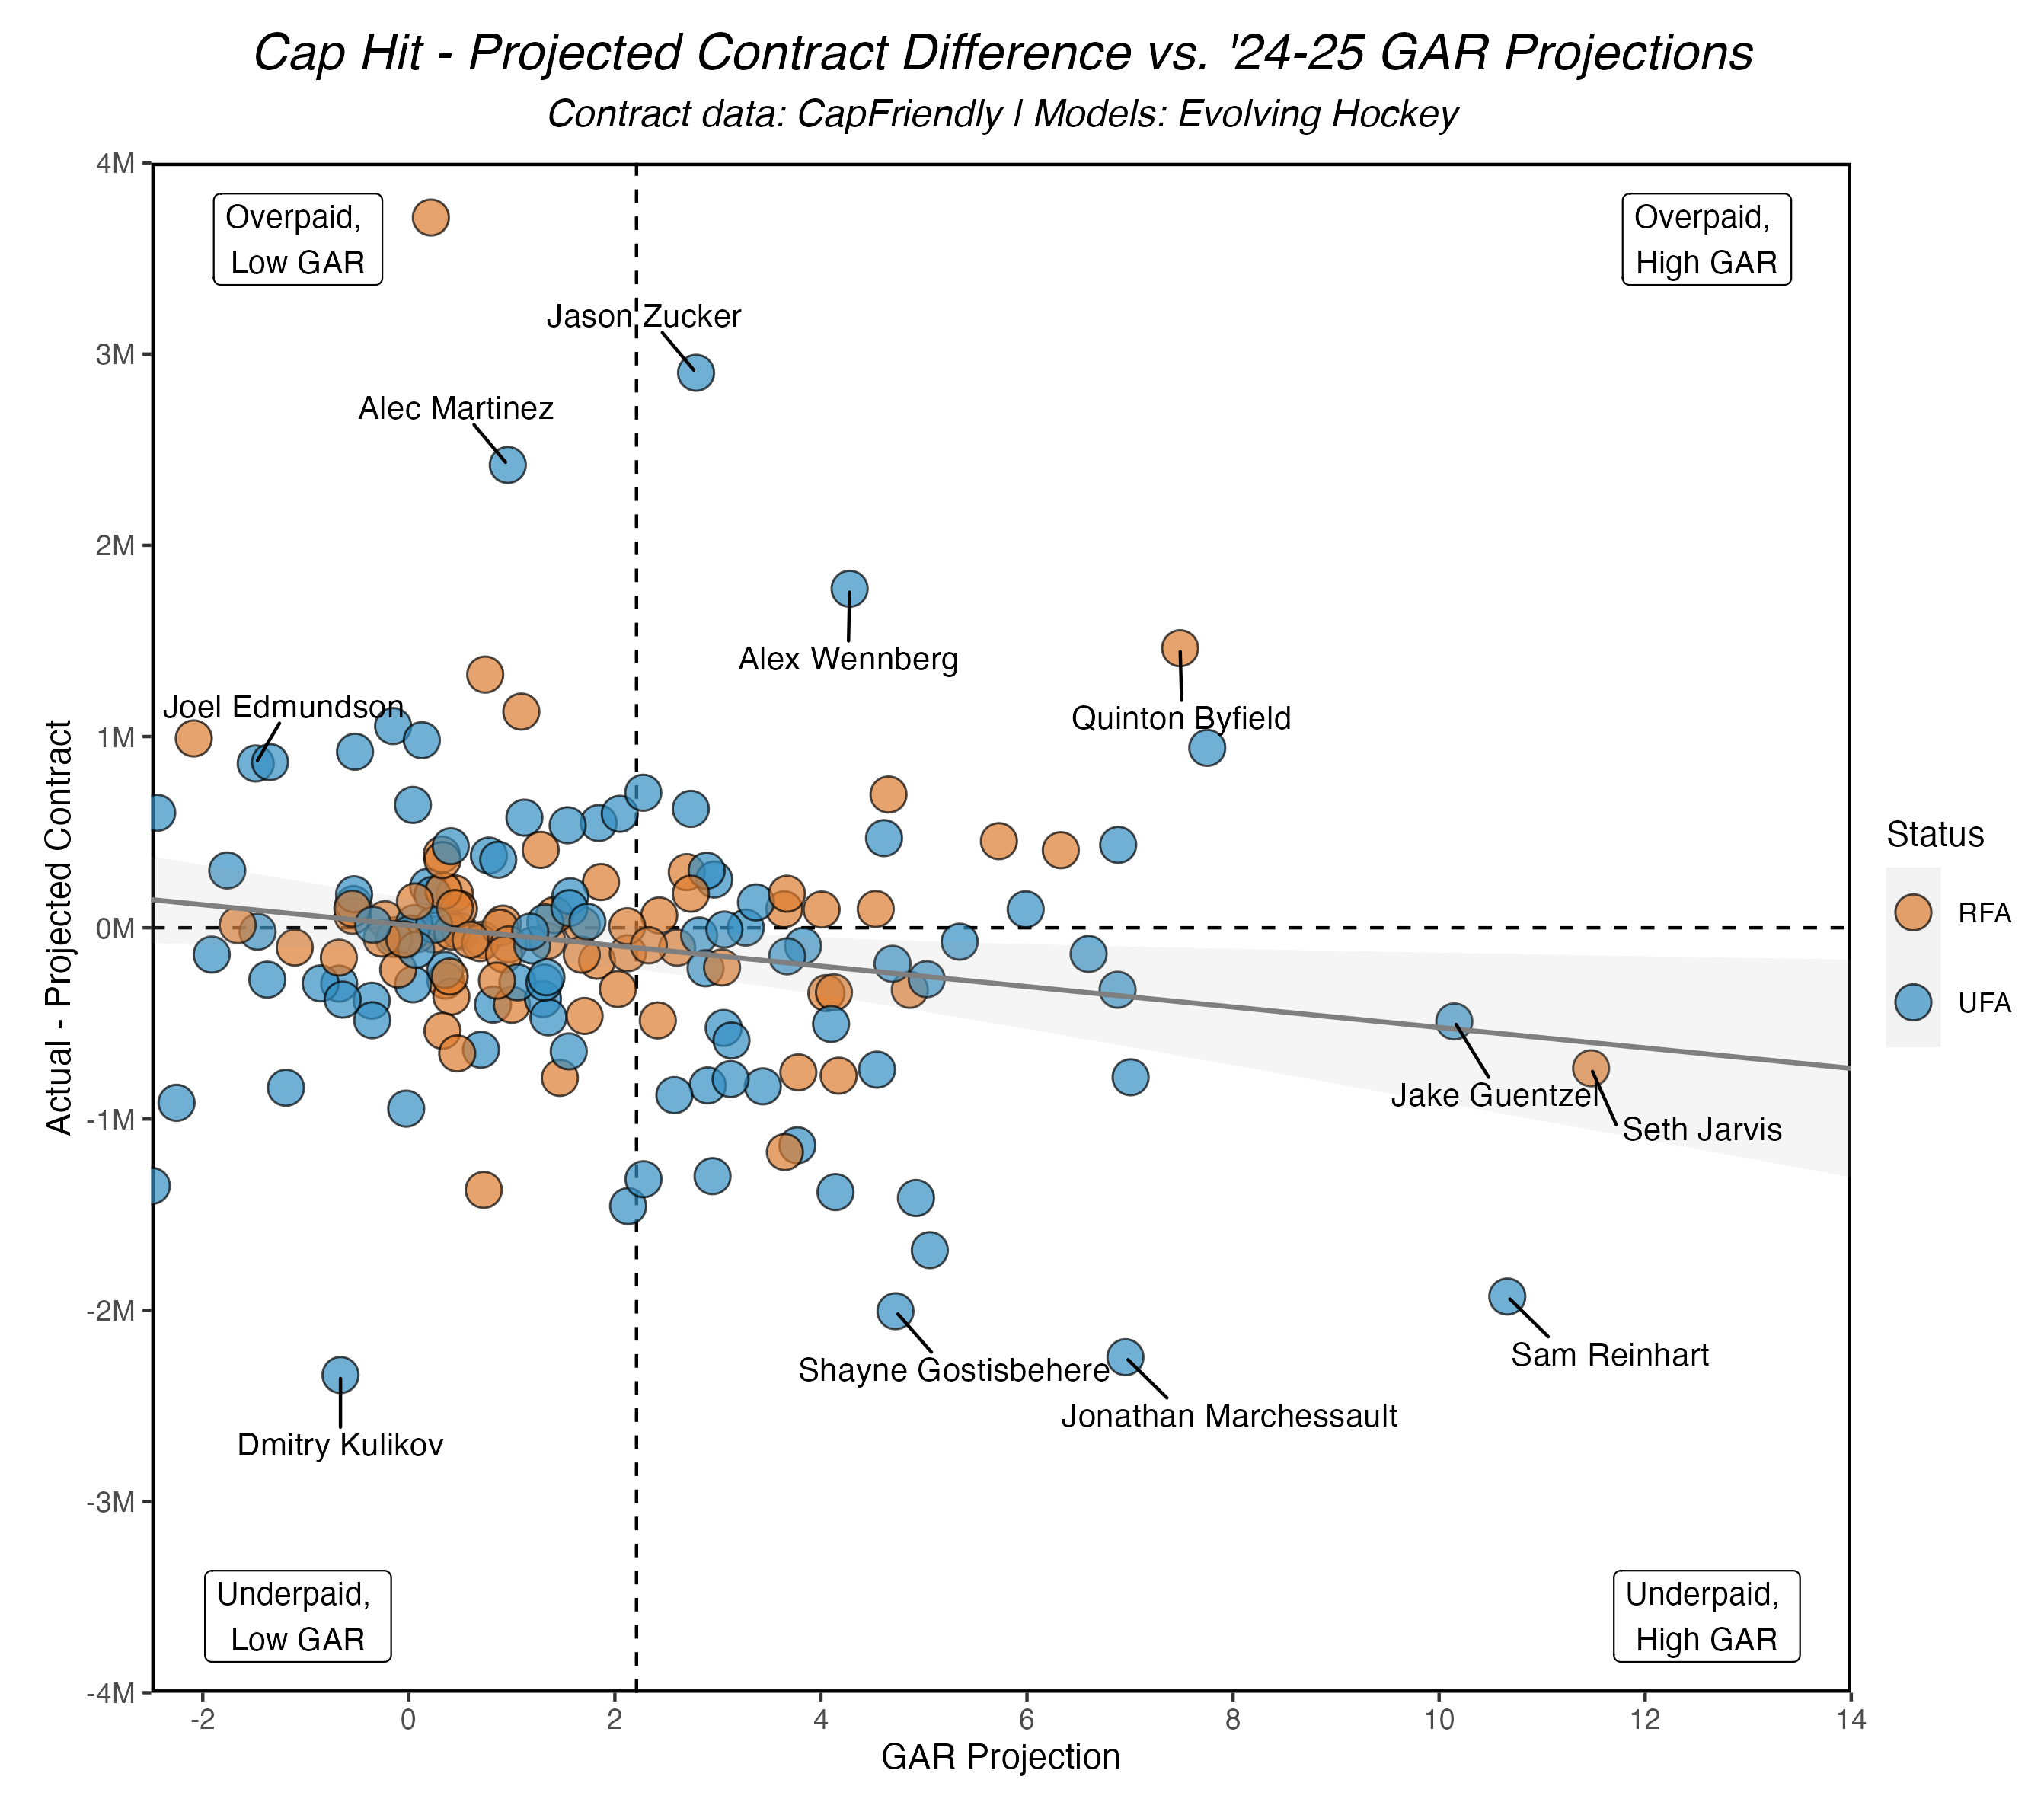
As I say every year, there is a lot going on here. What this chart shows is a comparison between the difference in actual & projected contract and each player’s respective GAR projection for the ’24-25 season. These two things aren’t necessarily related, but when we combine them, we’re able to investigate trends and outliers in the overall population of players that signed contracts this summer.
If we look at the overall trendline, we see a “return” to what we saw in ’21 & ’22: players appear to be, on average, underpaid relative to their expected value in the future. While I can’t necessarily say that any one single player was “underpaid” relative to expectation based solely on this chart, we can see that there is a group of players that were all underpaid who are all expected to be above average in GAR heading into next season (the outliers here are noted). Interestingly, there doesn’t appear to be any trend in RFA/UFA evaluation here, which is unlike last year where a significant number of RFAs populated the “right side” the chart here and were paid about what we expected.
As for those “overpaid” relative to their expected contract value, it’s hard not treat most of these players as outliers. Jason Zucker and Alec Martinez signed 1-year deals that far exceeded our projection, but they’re 1-year deals. I already discussed Byfield and Broberg above (Broberg is the circle in the far upper left of the chart). Alex Wennberg is the only player here that doesn’t necessarily have a clear explanation for the “overpayment”, and to be honest you’ll probably have to ask San Jose why they like him so much (he is a good player, don’t me wrong, it’s just a bit steep).
It should be noted that we are using projected GAR for the ’24-25 season and not a long-term projection akin to Dom Luszczyszyn’s contract evaluation approach. In theory, our GAR projections function in a similar way without the age adjustment employed by Dom. While our GAR projection model attempts to predict GAR for every player for the next season, it also has the secondary value of rating each player’s “true talent” given how it’s trained. We could theoretically employ something as simple as Tom Tango’s Marcel age adjustment, expand our projections based on contract length using this adjustment, and arrive at a similar result. Basically, we can slightly reduce our GAR projections for older players who have signed longer contracts, and we’d get close. However, this is definitely something I’ll be thinking about for next year’s evaluation.
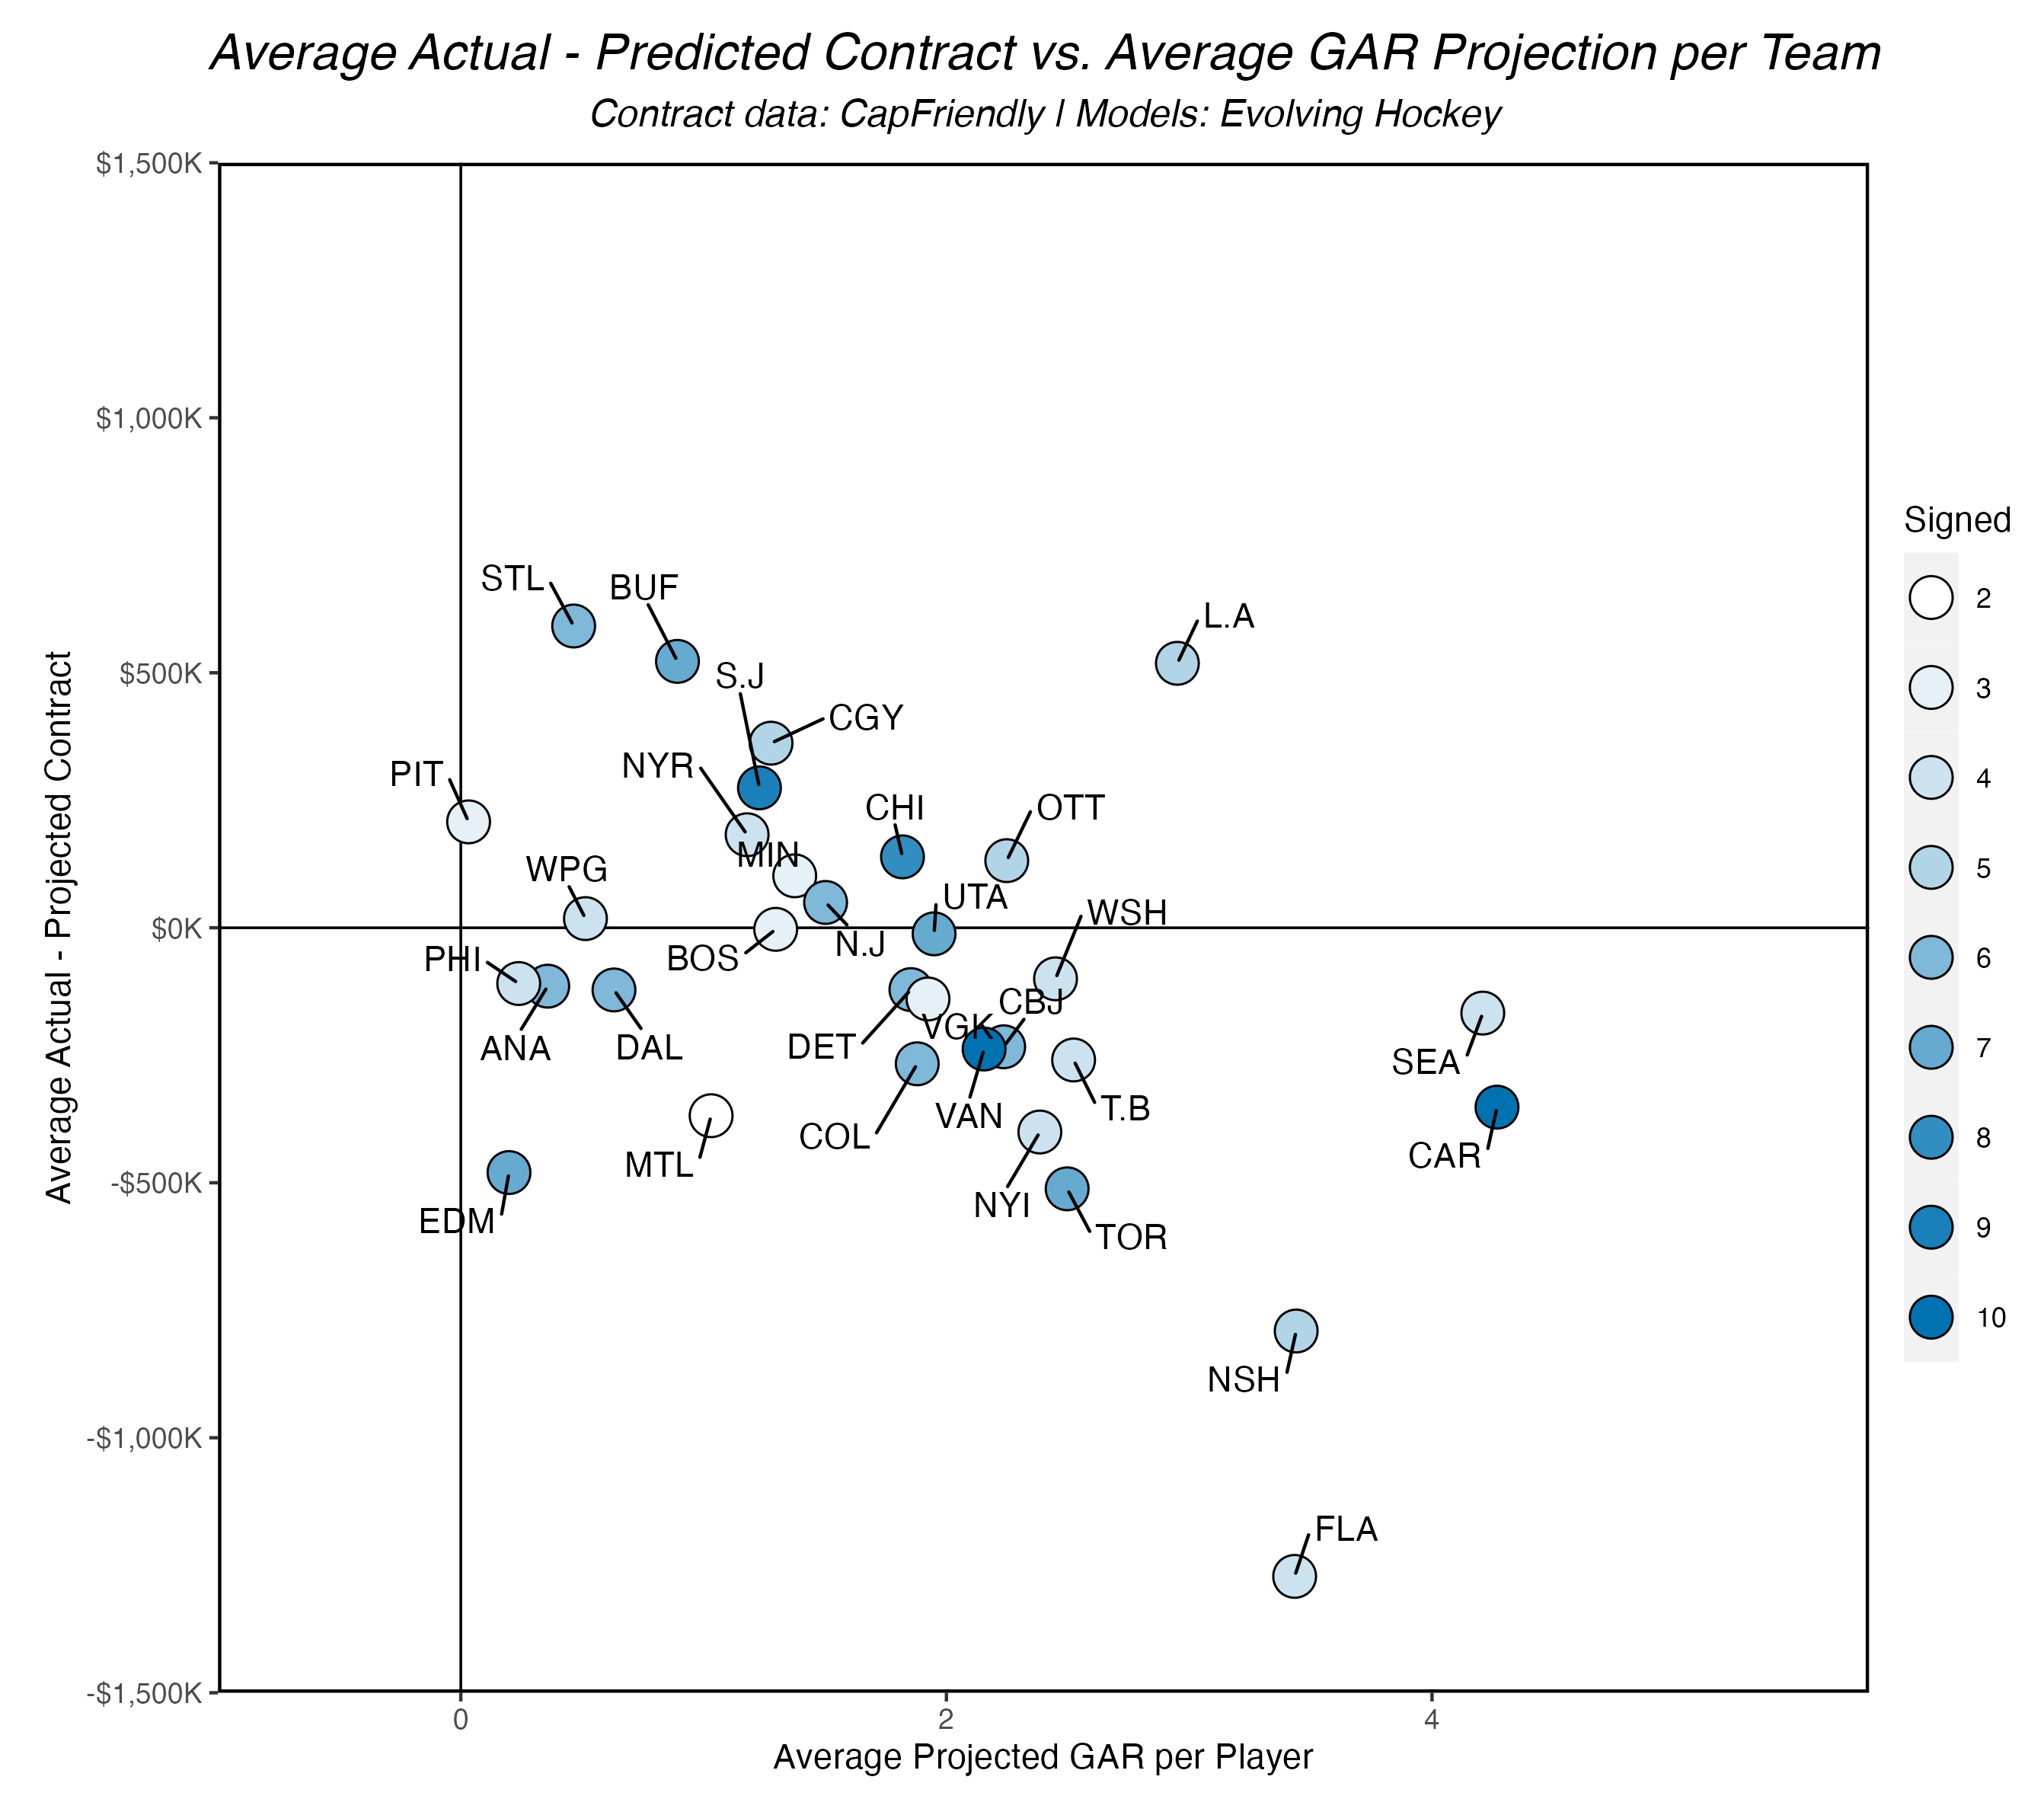
Here I’ve taken the same approach as above but summarized things down to the team level. What we arrive at is another high-level view of team signings while also accounting for our expected player value heading into next season. Just like the team evaluation bar graph from earlier, we need to be mindful of the number of contracts signed for each team. Carolina, who signed 10 players among those we projected contracts for, added the most in terms of average projected GAR. Florida and Nashville also stand out here for their efficient summers, but Seattle is possibly the most interesting. They only signed four players (Beniers, Tolvainen, Montour, and Stephenson), but all average well above average heading into next season. The Montour and Stephenson deals especially are ones we’ll be watching.
To finish this long exercise, let’s look at the top “under” and “over” paid players in comparison to our GAR projections:
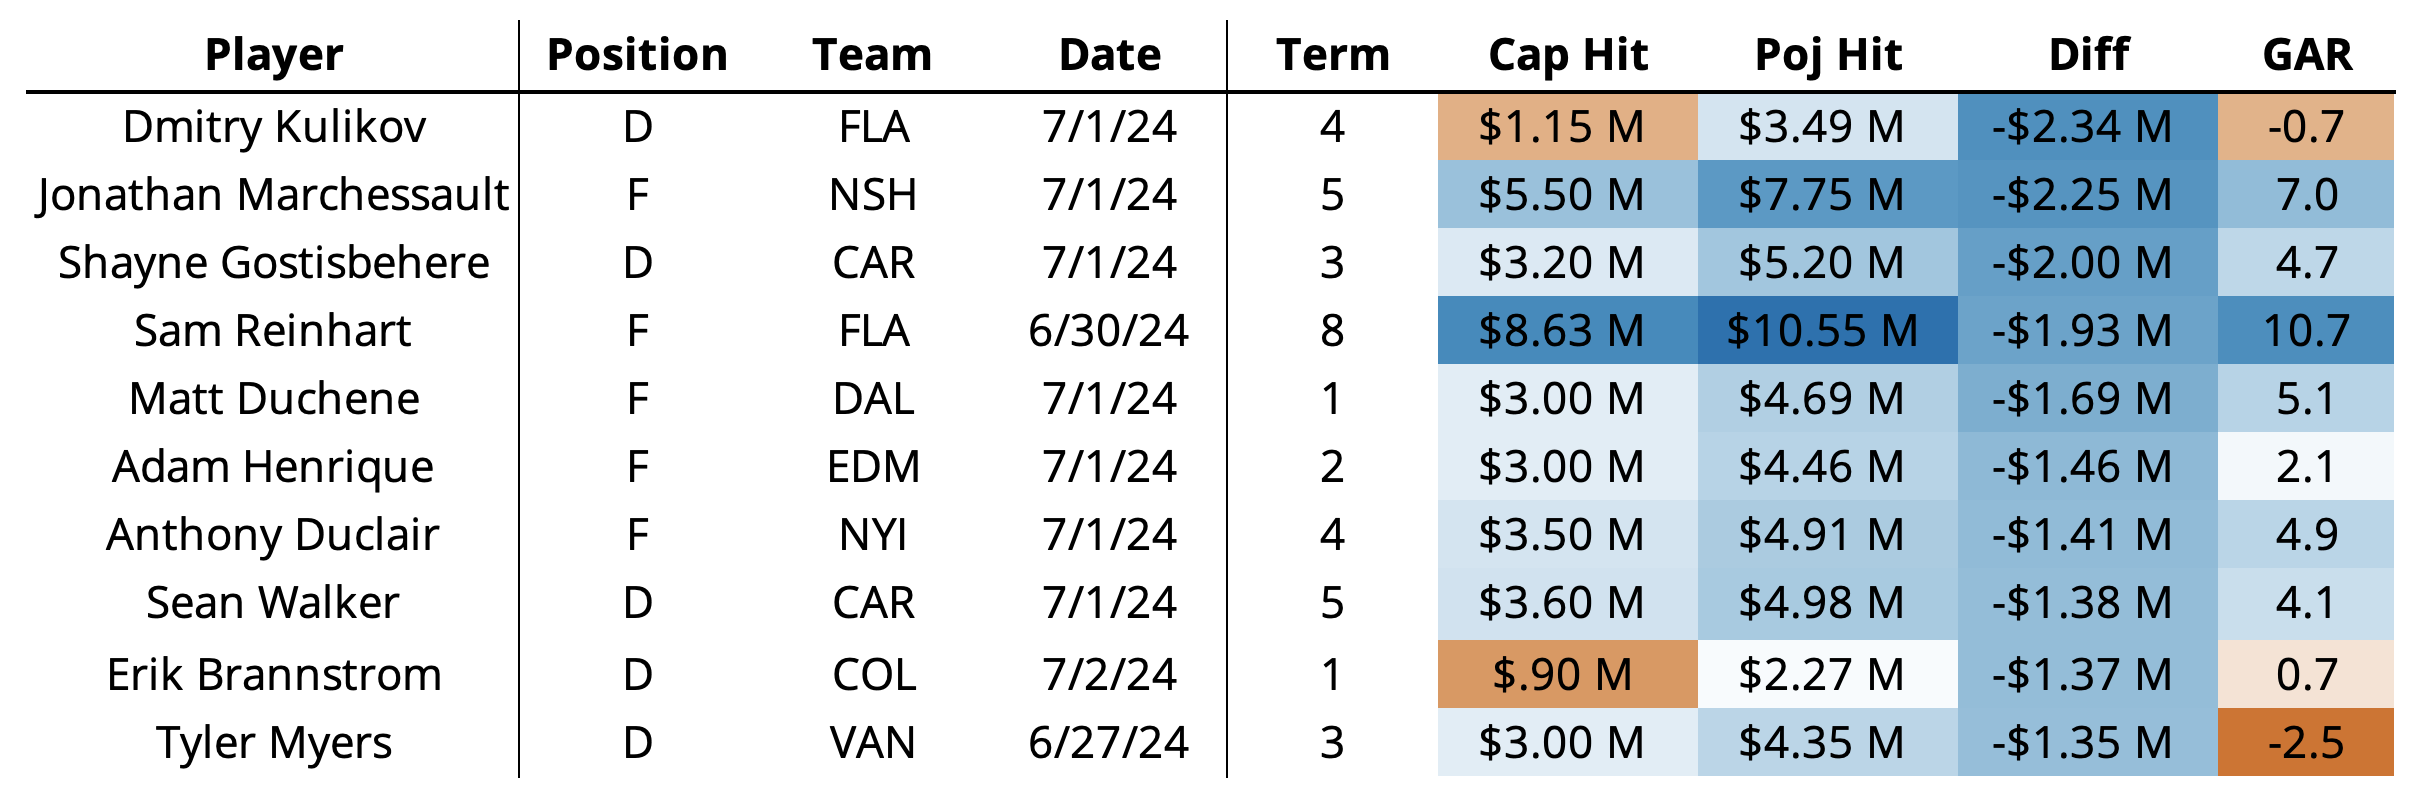
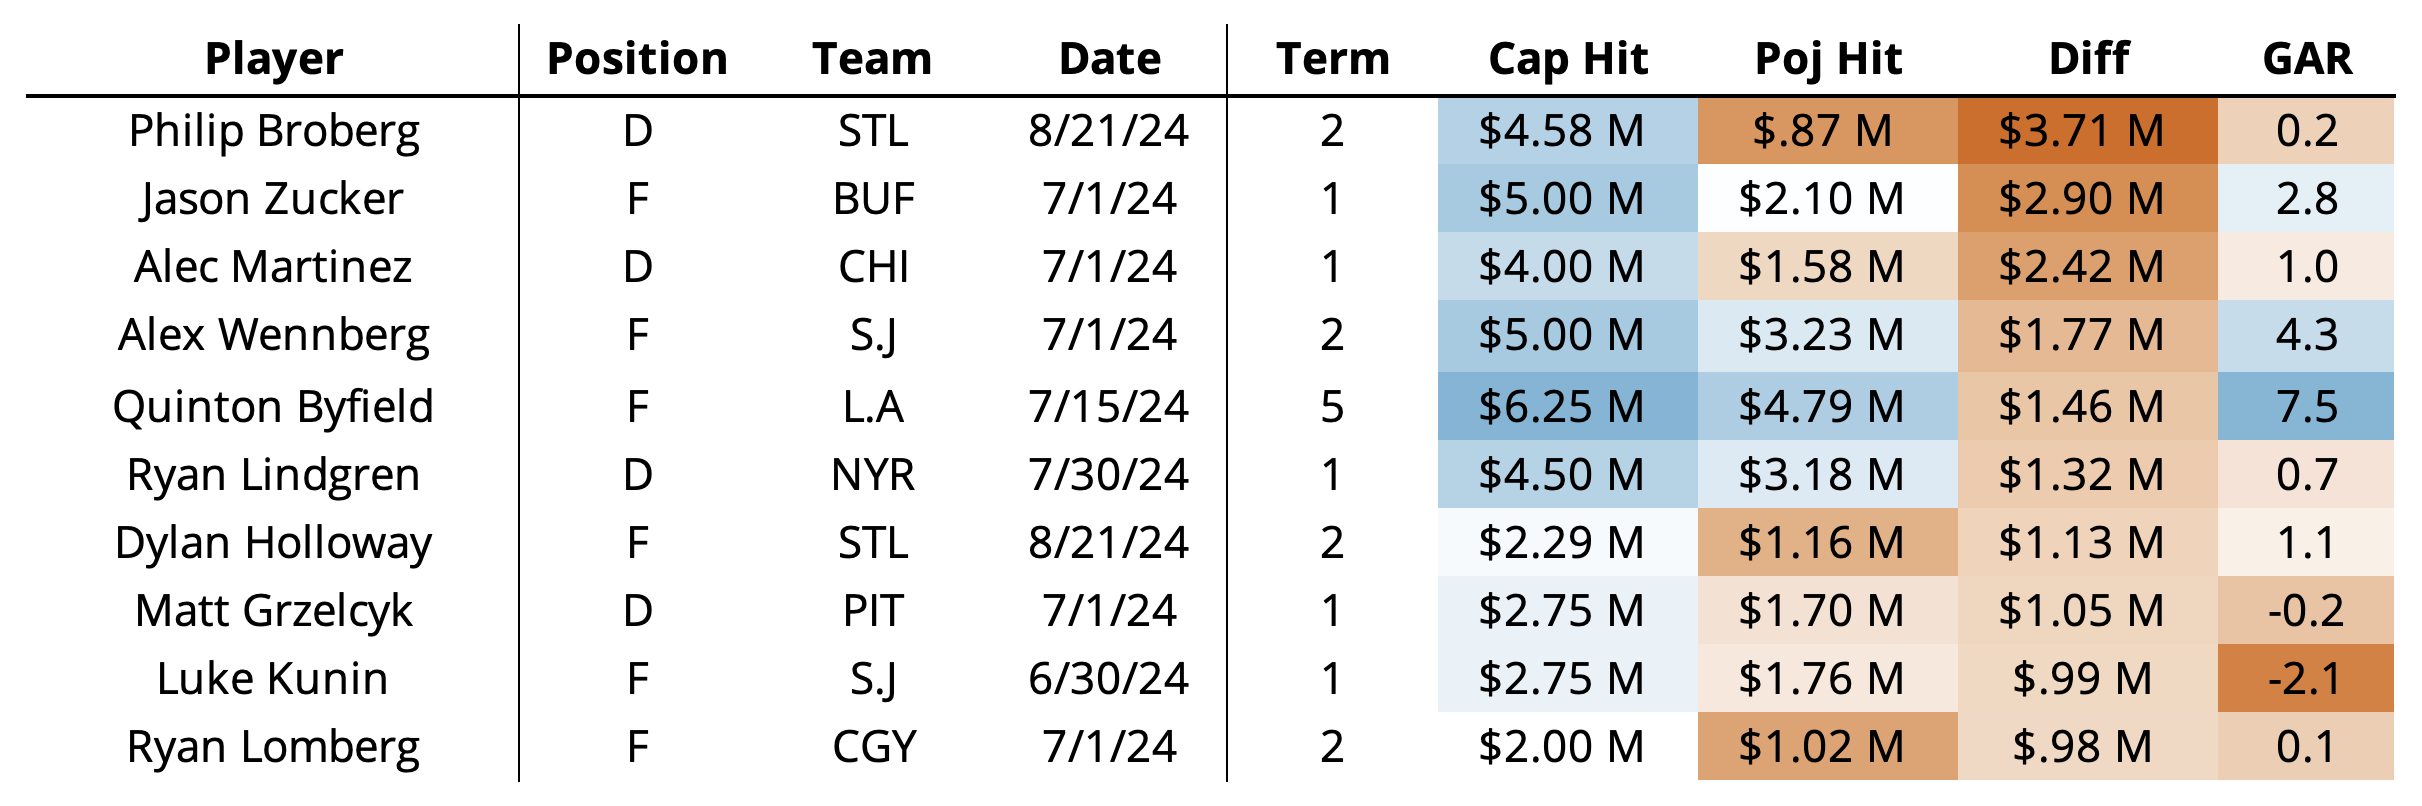
A decent number of the players we’ve already discussed show up here, but the spiciest are also here and we haven’t talked about them. That’s right. It’s OFFER SHEET time! I’m just kidding I don’t have much to say about those except it seems like the model was definitely not expecting offer sheets because why would it? Among the players I haven’t already talked about, Matt Duchene might well be the best “value” add even if he is 33 years old and it’s just a 1-year deal. Among the “over” players, half of them are also 1-year deals, which we tend to write off to circumstance and/or aberration. Byfield is the only player that signed a deal longer than 2-years, but it makes sense. Honestly, I’m sort of surprised by the lack of unsurprising elements here. That feels oddly in line with how the summer went.
Wrapping Up
It seems like the 2023 offseason was, just like we thought, more of an outlier than anything else. Given the now finalized salary cap increase that was impending last summer, that makes sense. With a $490k cap hit MAE and 0.861 R2, the model performed quite well overall. I already bragged about this, but I’d like to point out that I’m not bragging about this right now. As always, we’ll be making any necessary adjustments once next year rolls around. Additionally, we’ll be relying on our own tracked contract data now that CapFriendly belongs to the Washington Capitals. With that, we’ll likely be able to provide more contract data on the site in the future (more information forthcoming). The last thing I’d like to ask of the NHL is that they don’t sign a literal billion dollars worth of contracts on July 1. We have to track all of this now, and that would be way harder than if there were only like maybe 60 contracts signed on July 1 and then a nice even sprinkling of signings over the next month.
To all our subscribers and supporters, thanks again for following along with us, using the site, and posting hot takes this summer. We can’t thank you enough for everything. Here’s to another great, fruitful, and engaging regular season. Hopefully your favorite team wins it all!