Well, this has been one of the NHL offseasons that’s ever happened. We’re almost 8 weeks removed from the start of free agency, and this one just straight up sucked actually. One of the big reasons? Well, Twitter decided they didn’t want any of us having fun on our favorite day of the year and blocked us all. And despite a few rather interesting trades, we’ve been left with a rather boring summer for hockey fans interested in playing their favorite team’s GM and arguing with people online.
Having said all that, I’m not here to bemoan this summer’s boring free agency or the state of social media in 2023. I’m here to evaluate our contract projection model on Evolving Hockey dot com! That’s the good stuff right there. As is tradition on this website, every year I like to do a full review of free agency through the lens of our contract model. Not only does this, at least in my opinion, provide a good overview of what happened and how teams fared, it also lets us discuss the model’s performance and potential trends in the market.
Model Evaluation
For those of you unfamiliar with our contract projection model, please reference the following:
- Original article
- Glossary
- Summary from our review a few years ago
If you’re not in a reading mood and are new to the site and/or to us, we provide contract projections for all players in the NHL here at Evolving Hockey. This is mainly focused on free agents in a given offseason (due to the large majority of new contracts being signed during this time); however, we also provide projections for every other player as well (including a handy feature to view extension-eligible players). The “model” itself is actually two models that we combine into one “main” projection: one model predicts the most likely length of a contract (1-8 years), and the other model predicts the most likely cap hit at the given term (in the form of percent of the salary cap – set for the expected salary cap of the next season). This results in a range of projections between one and eight years for all players. Our “projected” value on the site is the highest likelihood for a given term and the corresponding cap hit at said term.
For evaluation, we take all contracts signed since the model was updated (in this case, May 3rd, 2023) and compare them to the projected contract at the actual term signed. A reminder: all evaluation that follows will exclude league-minimum contracts ($775k for the ’23-24 season). In general, league minimum contracts make up a good portion of the contracts signed in any given summer – 108 contracts signed among those we projected have been at league-minimum. Not only is this a large portion of all contracts signed in a given offseason (this summer isn’t unique), they also are much easier to “predict”. If we wanted to look really good we’d include these in evaluation, but Luke and I are totally fine not looking good.
Some data notes:
- All data is provided by CapFriendly. None of this would be possible without CapFriendly. They are the absolute best.
- All skater metrics used in this process are from Evolving Hockey.
- We projected contracts for 402 potential NHL free agents this summer. 116 of these free agents remain unsigned: 44 RFAs and 72 UFAs. The average age for the remaining unsigned UFAs is 31.
- Of all remaining free agents, we projected less than 40 to sign a contract over $1M per year. Only Trevor Zegras, Evan Bouchard, and Patrick Kane have projections over $4M at the projected term (Kane is a little under $4M now that we’re in the “holdout” period, but it’s close enough).
- A total of 178 contracts (skaters and goalies) are included for evaluation (after filtering out league minimum and non-projected players).
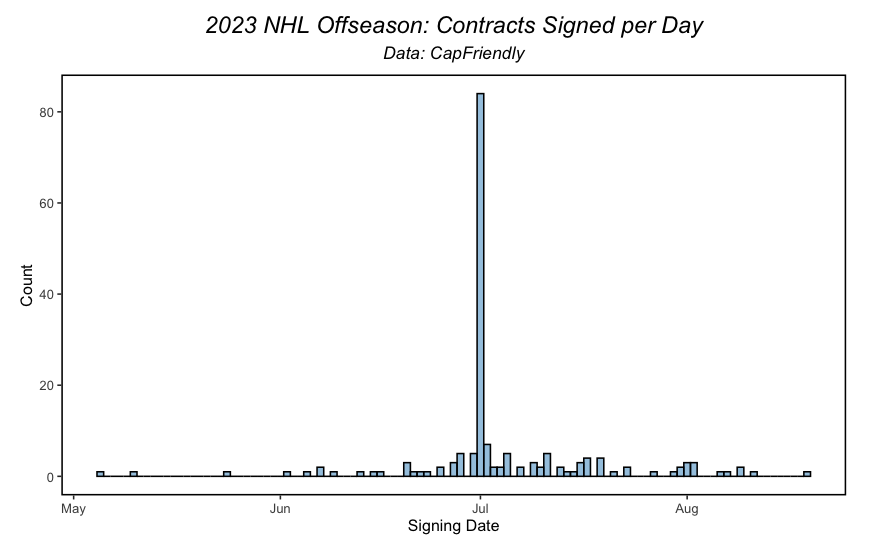
Alright, so onto the actual model evaluation portion. First, for fun, let’s look at the timeline for contract signings this summer. There’s nothing unique here. More than 80 contracts were signed on July 1st, and the majority were signed during July. I just thought a few of your may find this interesting.
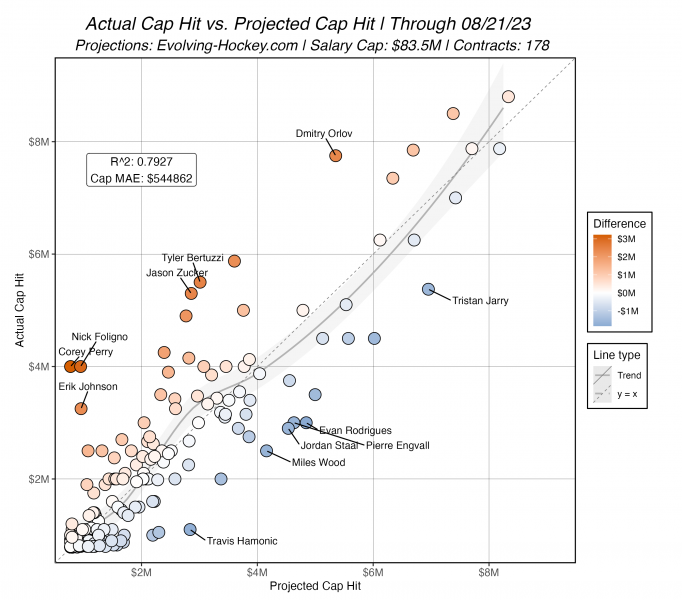
Let’s look at a few comparisons between our projections and the actual contracts that were signed. Here is the comparison between our projected per-year $ value for all signed players and the actual cap hit that was signed along with the R2 and MAE (mean absolute error) values for all free agents. I’ve included both the x = y line and a general loess (local regression) trend line for calibration’s sake.

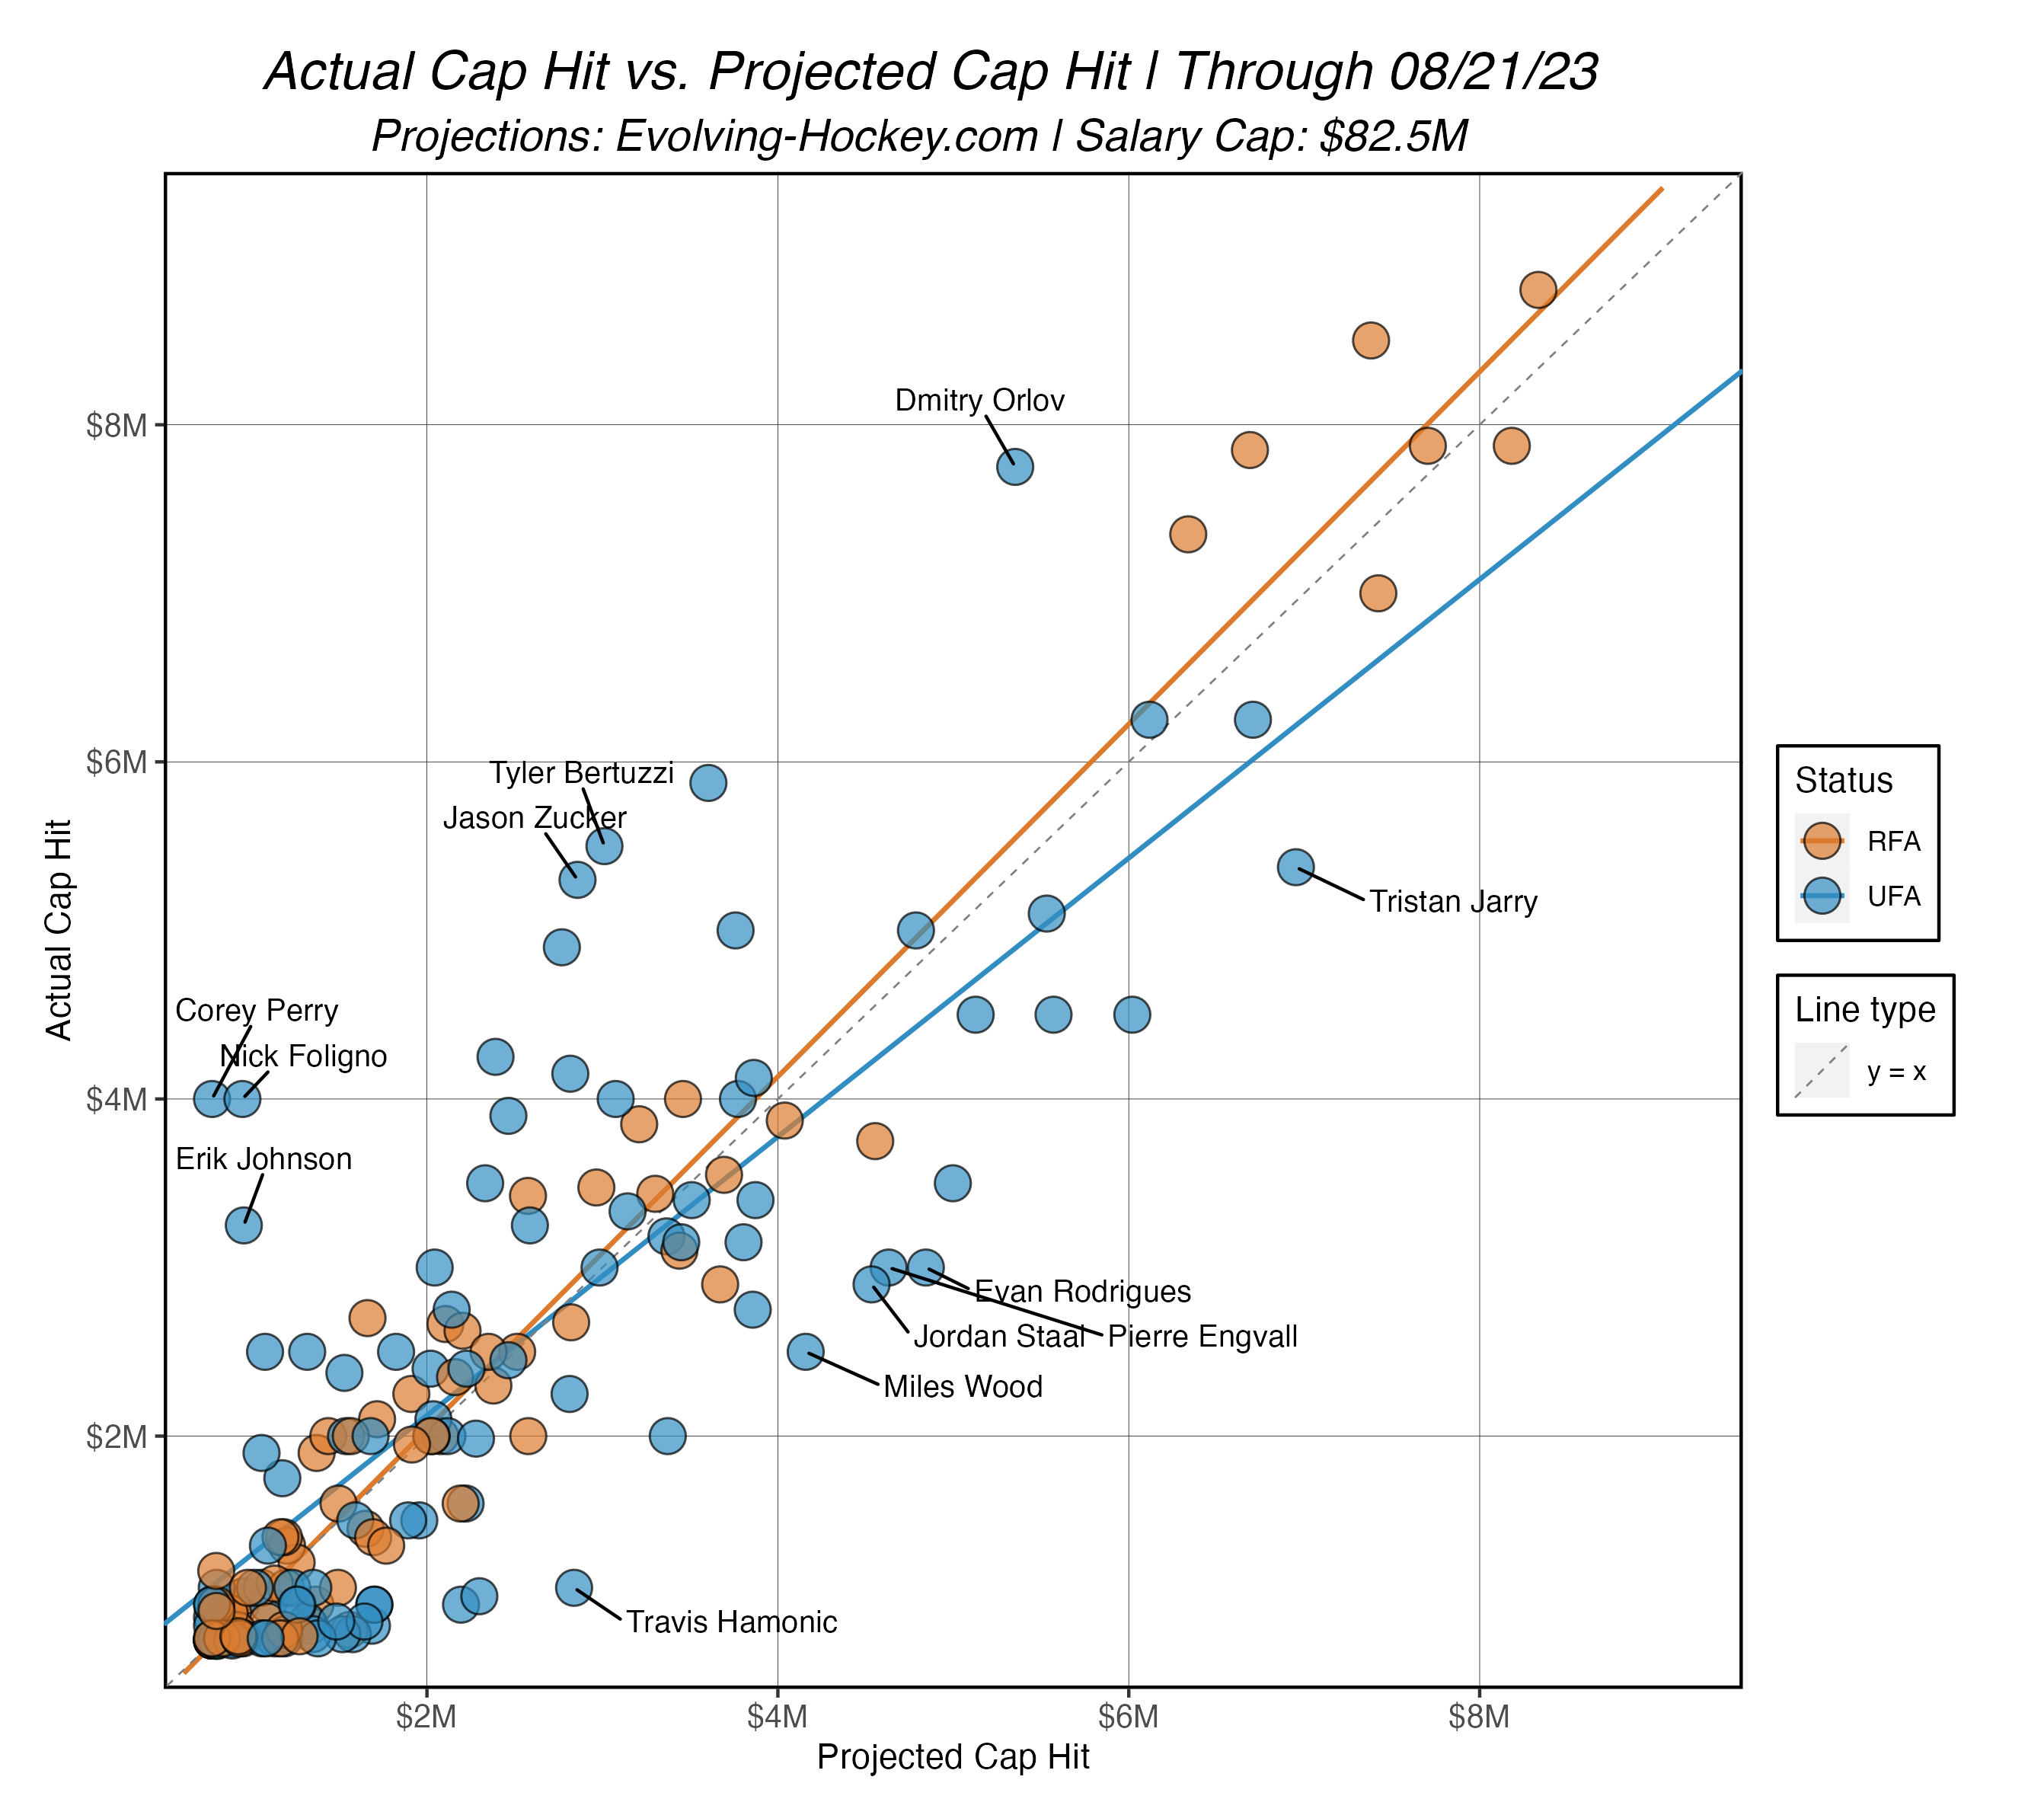
The same comparison highlighting UFAs and RFAs:
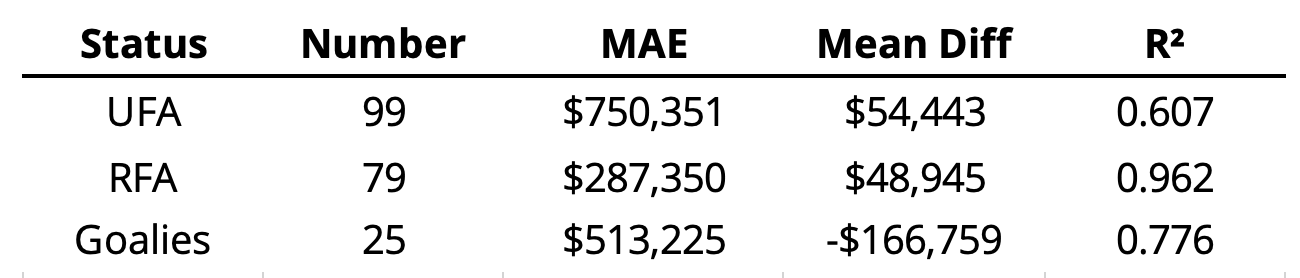
Evaluation for each status:
And finally, the distribution of actual – projected contract differences for non-league-minimum contracts so far:
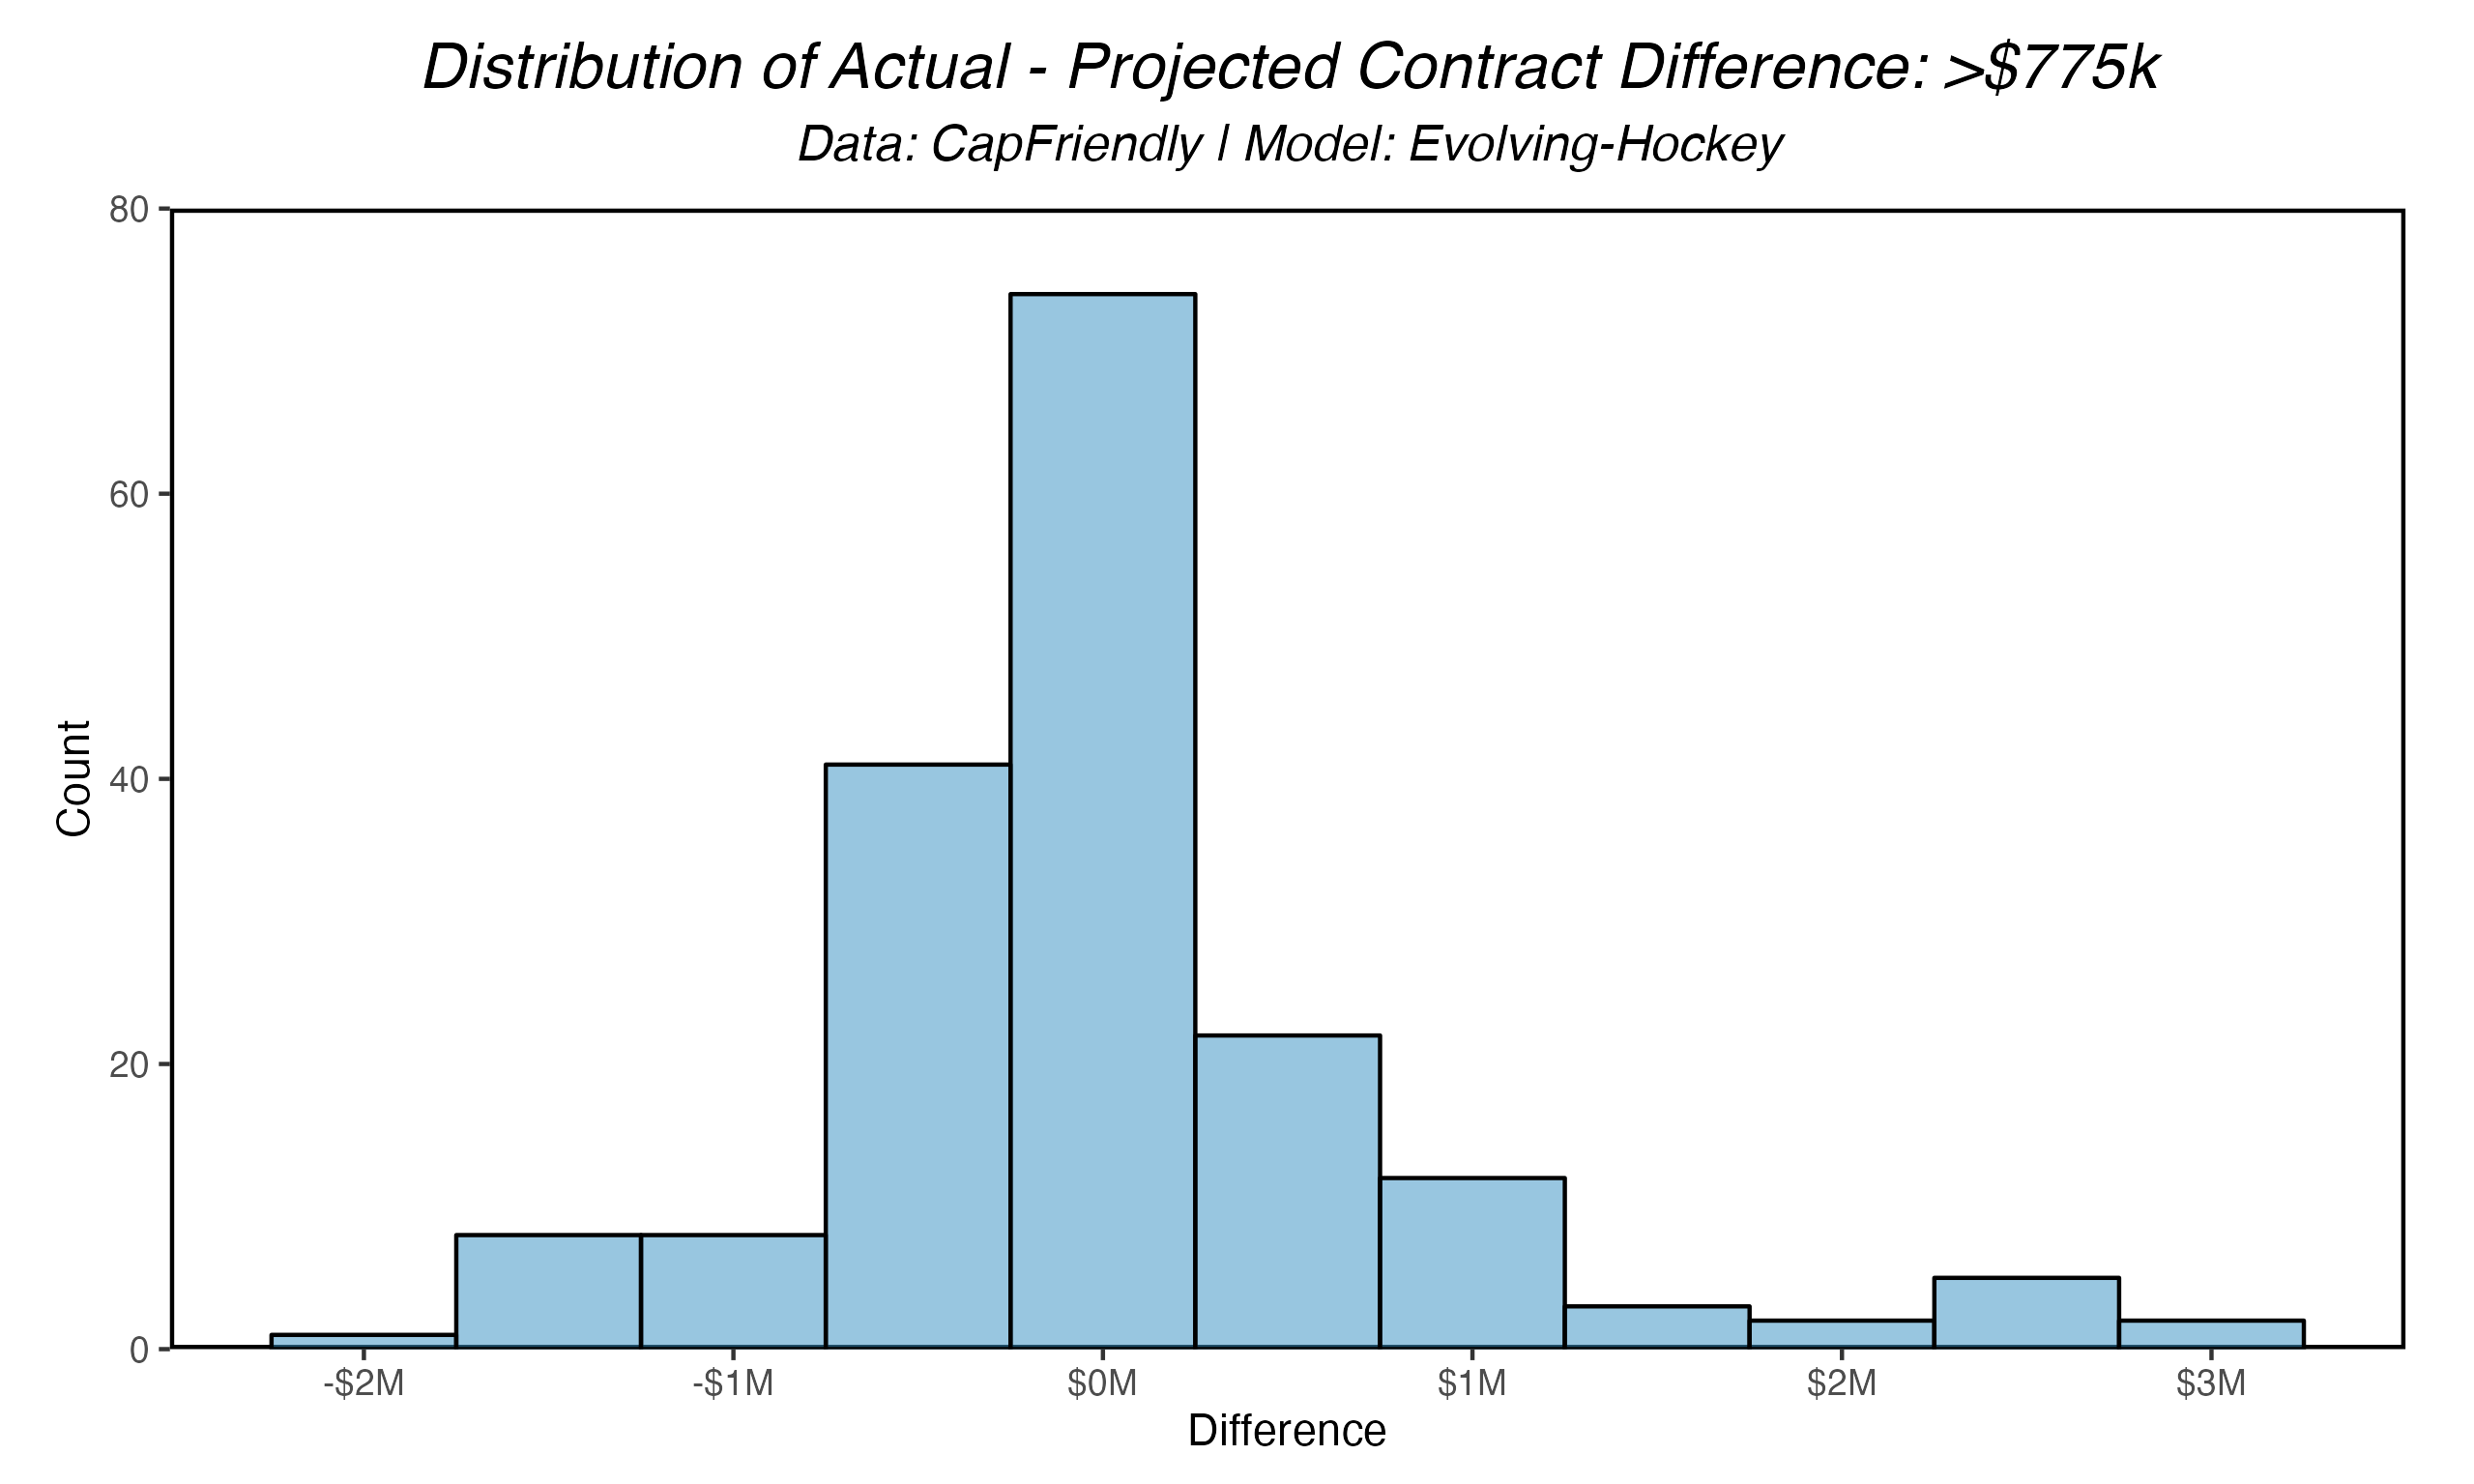
First the good news: this is possibly the best calibration we’ve seen from the projection system since it was created. We’ve talked about this at length (both in writing form and on our podcast, which you should definitely check out), but “calibration” is something that we spend almost as much time working on as the actual predictive power of the model. True, they often go together, but historically we’ve found it quite difficult to achieve a trend that mirrors the x = y line. What do I mean by calibration? Basically, we’re looking to have the same “error” for $1M per-year projected contracts as $5M contracts as $10M contracts. Usually, this isn’t the case. For instance, last summer, the model tended to over-predict contracts for players who signed >$5M and under-predict contracts for players who signed <$2M. This season, outside a small blip ~$3M, the model has been extremely consistent throughout the range of dollar values. With that said…
The bad news: this is also the “worst” year we’ve seen from the projection system since it was created. Now, the difference here is possibly marginal. But for us, a difference of 0.0669 R2 is a big deal (I’m kind of kidding, but also not really). We were ~$100k “worse” in raw contract value compared to last season (for reference), and MAE is usually the metric we focus on given the model was trained using this (R2 is not necessarily the best metric for evaluation in this modeling problem). That said, we’re still quite happy with how the model performed given the current environment. As I covered in our preview, the NHL is in one of the most interesting periods of the last decade or more. And clearly we’re seeing that here. While the model may have underperformed relative to past years, the contracts causing the increase in error here, at least in my somewhat biased opinion, have some non-model attributes that can be explained (below).
For RFAs, we’ve never seen better numbers from the model; <$300k MAE, an R2 value over 0.96, and mean difference <$50k. I’m not sure we’re ever going to have a better summer for RFAs. Now if we could just get rid of those pesky UFAs, eh? We’ve seen numerous unprecedented deals in the wake of the rumored salary cap increase(s), and due to numerous other (seen and unseen) aspects, the market is in turmoil. I almost said “semi-turmoil”, but I think it’s actually turmoil after looking up the definition. Also I added goalies in the table above, as you may have noticed. There are only 25 of them, and they are goalies, so I’m not going to say much about them, but they’re not helping things.
So what does this all mean? What’s going on? Last year I had a few things to say about the market and how I thought the “flat cap” was influencing things. This year I’m a bit more certain about my feelings: this was a weird, bad, and boring summer. The unrestricted free agent class was severely uninteresting. Both teams and players have, so far, played it safe with short term deals, often unprecedented (Orlov, Bertuzzi, Zucker), while waiting for the salary cap to get sorted out over the next year or two. Chicago decided to sign Corey Perry and Nick Foligno to absurd 1-year deals, likely needing to hit the cap floor with some additional intangibles. Almost every team signed or likely will sign their RFAs to reasonable deals within expectations. We’ve yet to even hear a rumor about an offer sheet when, given the UFA market and cap situation, several teams seemed in a good spot to try one. We couldn’t even get one offer sheet to make this summer fun could we? Rant over. Bottom line: this summer was weird.
Team Evaluation
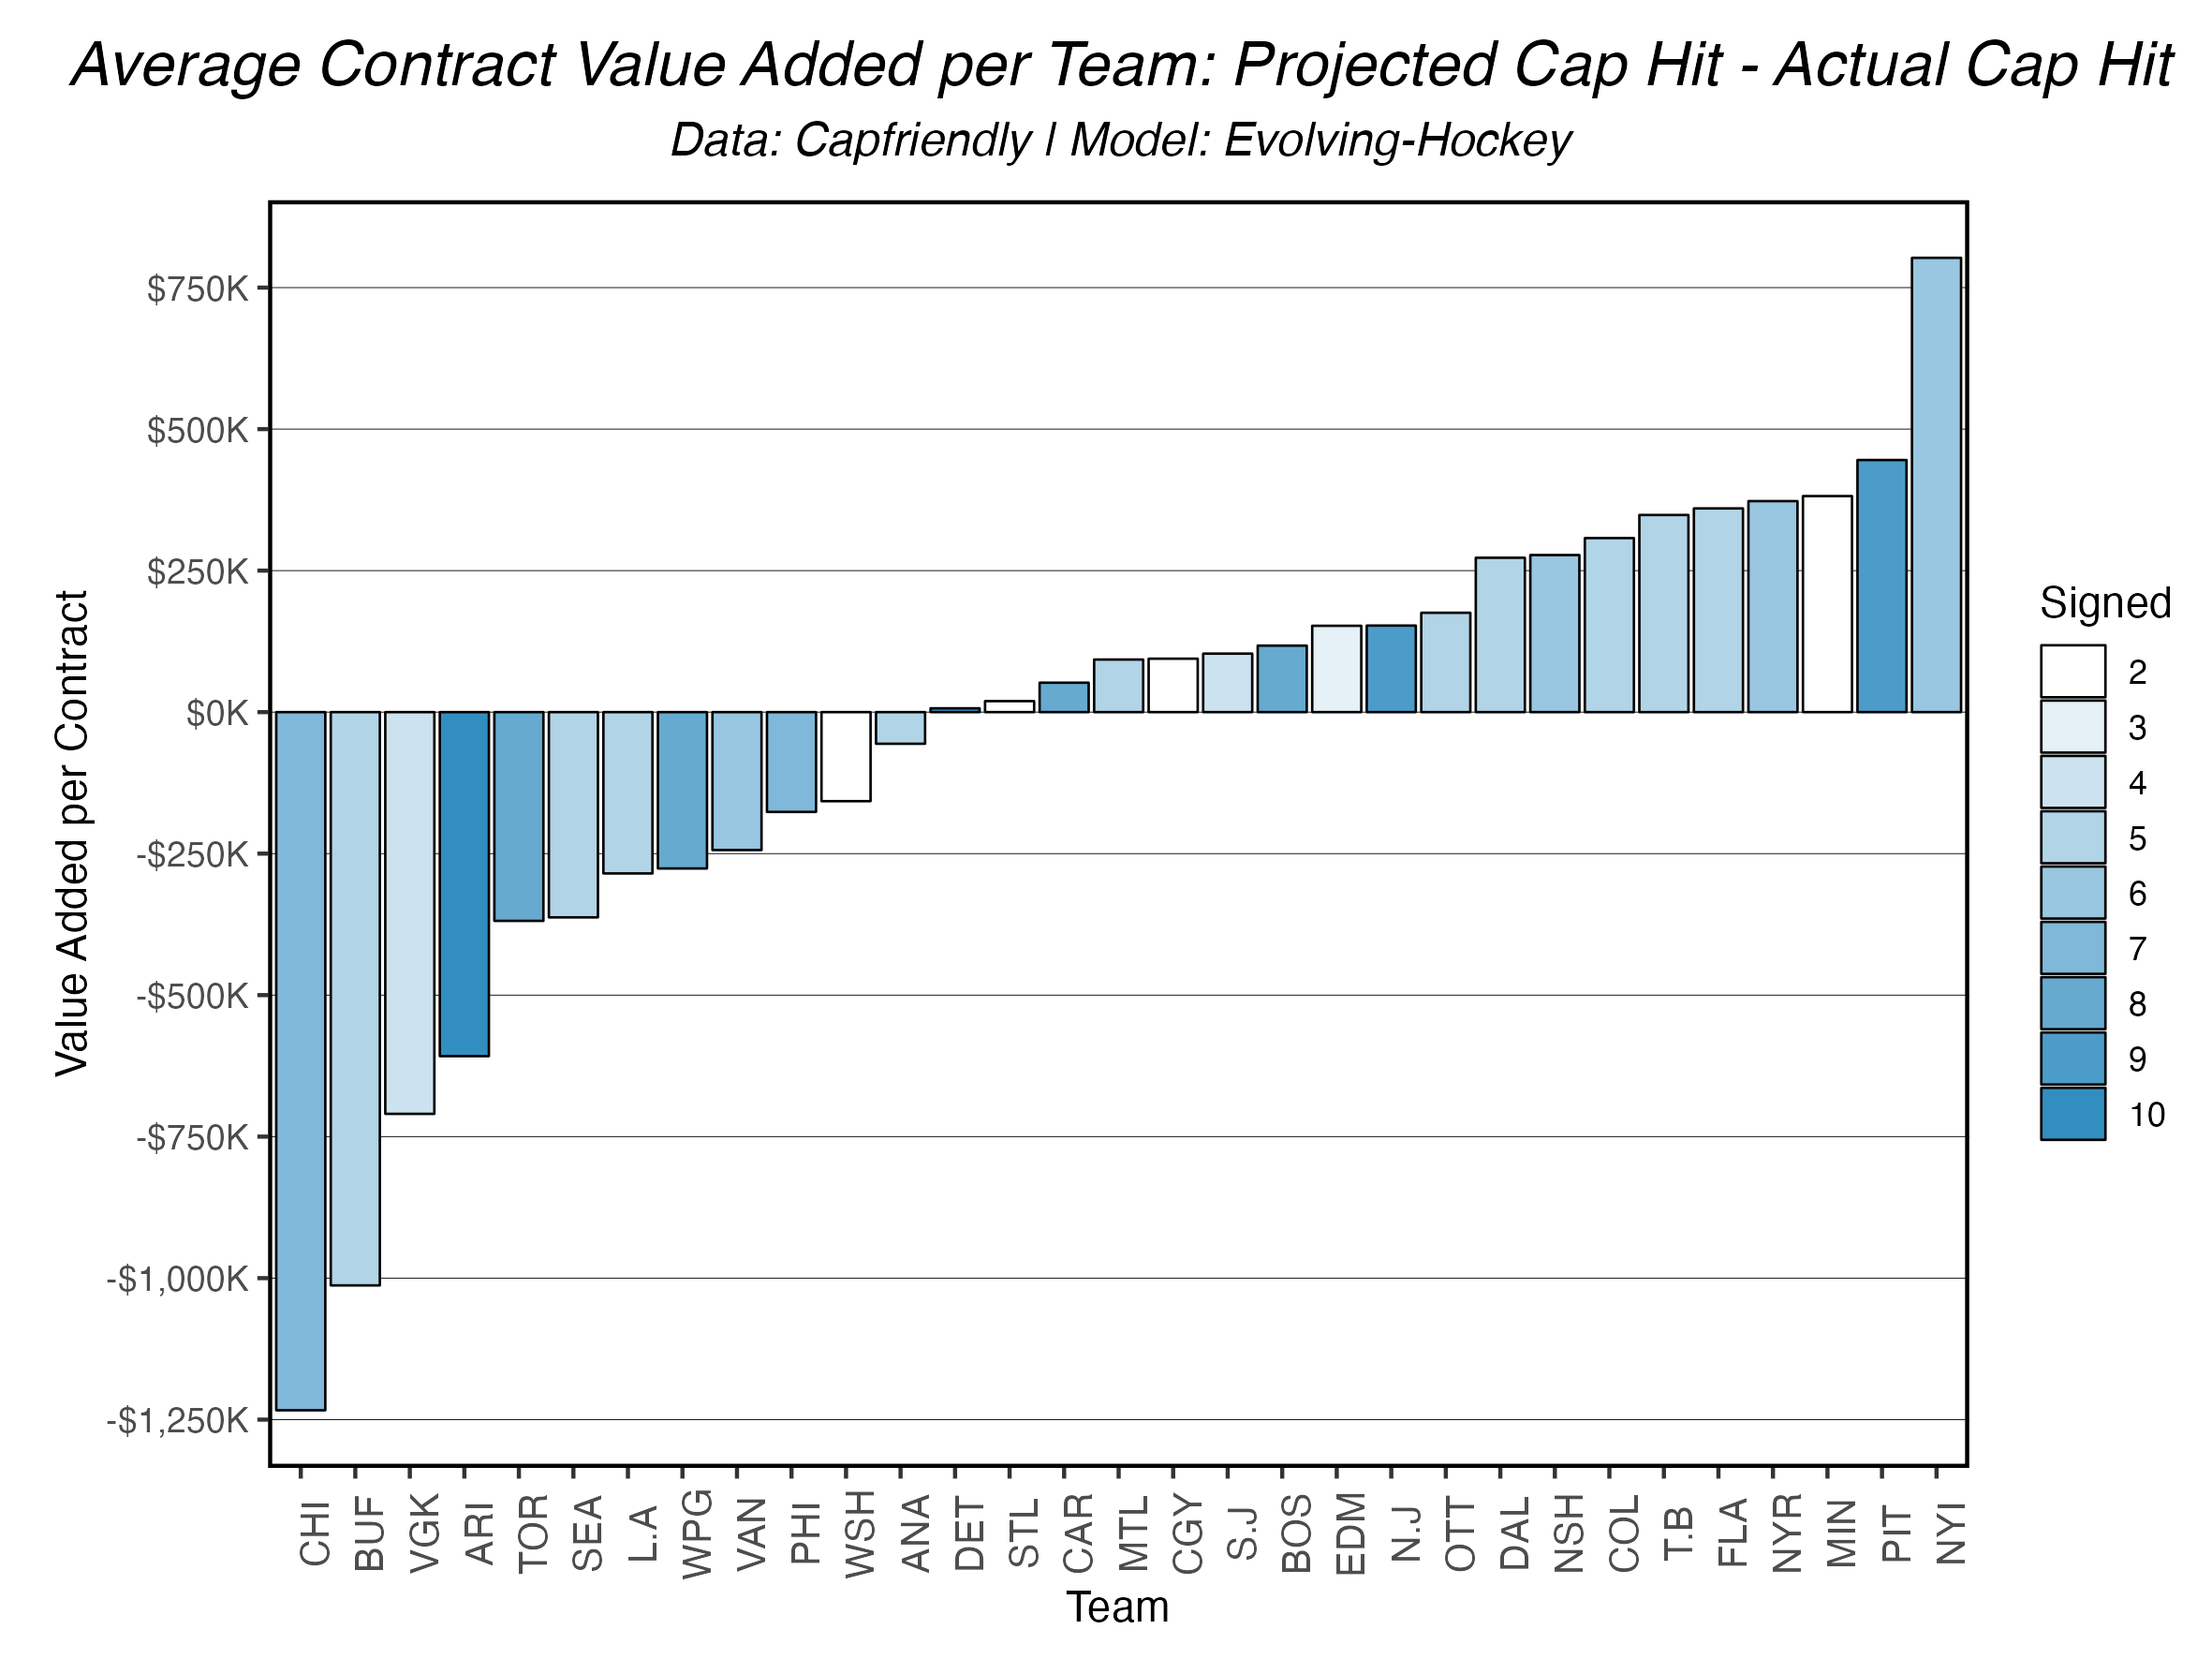
Above, we see the average value added for each team this summer (again comparing actual vs. projected values of our contract projection model). This also gives us a good idea of how many players each team added. Please keep in mind, even for teams with the most players added, we’re not dealing with many contracts here.
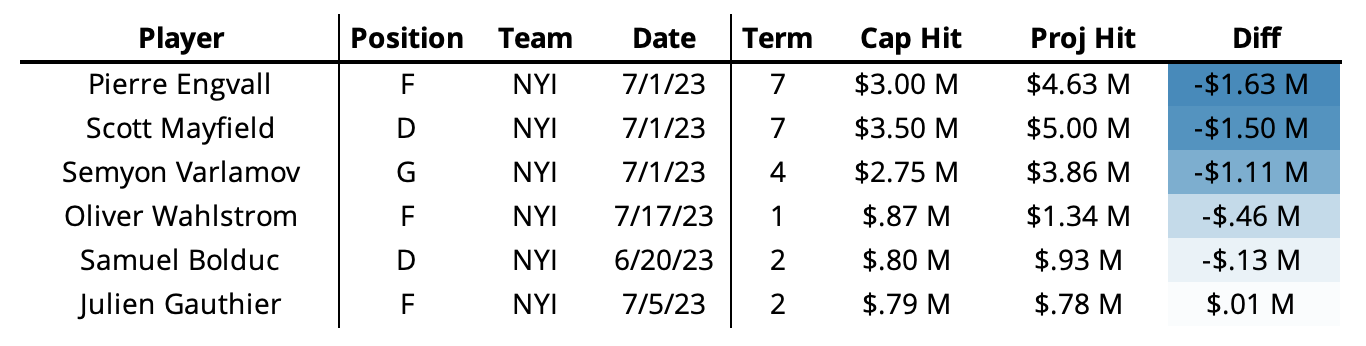
According to our model, the Islanders had the “best” summer of any team. Now… let’s pump the brakes right away here; there’s a caveat. The Engvall, Mayfield, and Varlamov contracts are doing a lot of work for this result. All three players signed contract lengths with less than a 2% likelihood per the term model. And due to certain aspects of the projection system, the 7 year deals carried with them a much higher expected value than what was signed. Ironically, Engvall was the player with the highest “value” in our preview a few months ago. Either way, the Islanders are committed to a plan, and they followed through on that plan. Who knows? Maybe these will look like steals over the next few years. We’ve always been Engvall believers.
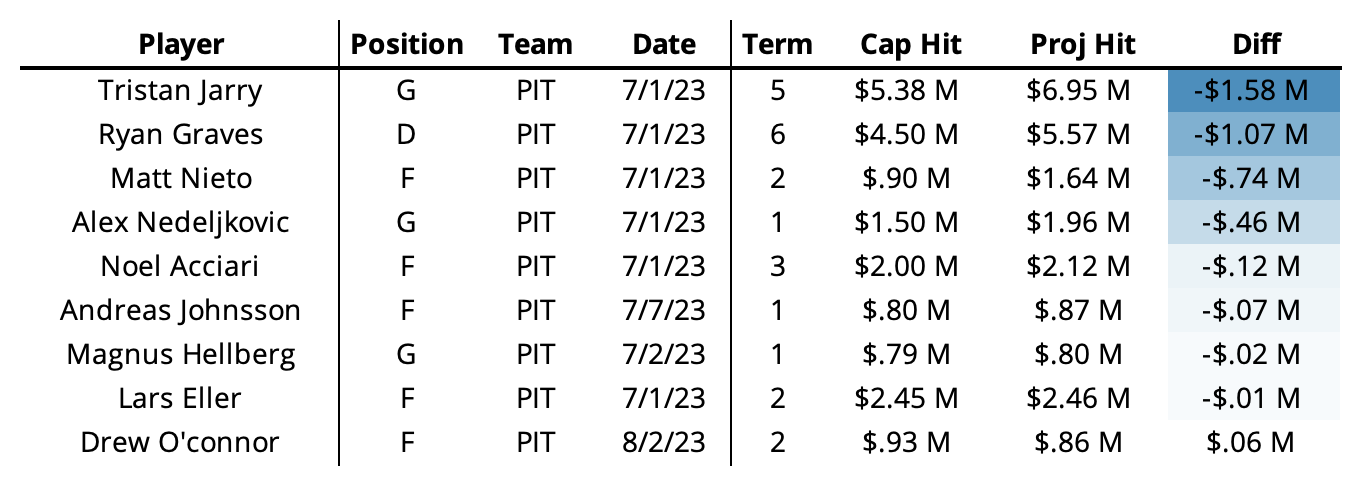
Kyle Dubas and company, at least according to Evolving Hockey, had themselves a nice little summer. Now, I know certain fanbases on the East coast (including Pittsburgh) had some comments about the Jarry deal, but we’ve always been a bit higher on him than public perception (possibly inflated due to his extreme value in 58 games two seasons ago). The model was ~$1.5M higher at a 5-year term than his actual cap hit, and given the existing UFA goalie market in July (Andersen…), it makes some sense why the Penguins locked in Jarry for a longer deal. Other than adding Graves, Pittsburgh secured quite a few lower $ contracts at a good value overall as well.
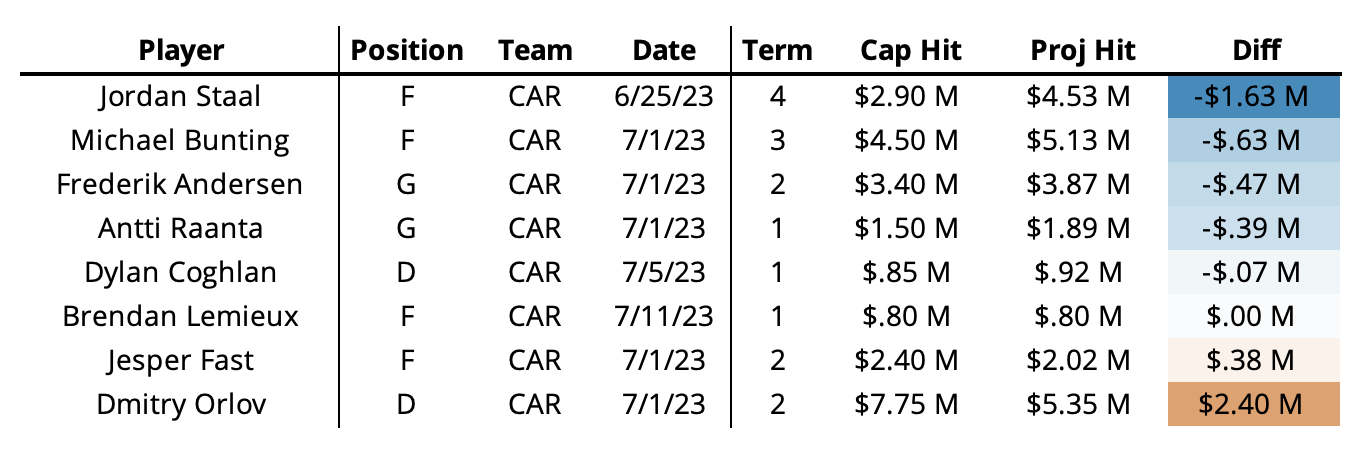
The Hurricanes may have had the most interesting summer of any team from a contract perspective. Bunting was a fascinating free agent given his recent track record and “doubts” about teammates inflating his production in Toronto. He along with Fast were among the players we highlighted as potential best value free agents this summer in our preview. Dmitry Orlov, on the other hand, signed a patently strange deal at two years (if you trust our contract model). Now, there are clearly reasons for this, and the Hurricanes seem to be betting on a good year or two of production at this price (he’s still projected to be a top-40 defensemen heading into next season per our player projections). Locking in Andersen and Raanta for another season isn’t too shabby either. Carolina is setup to challenge in the East this coming season.
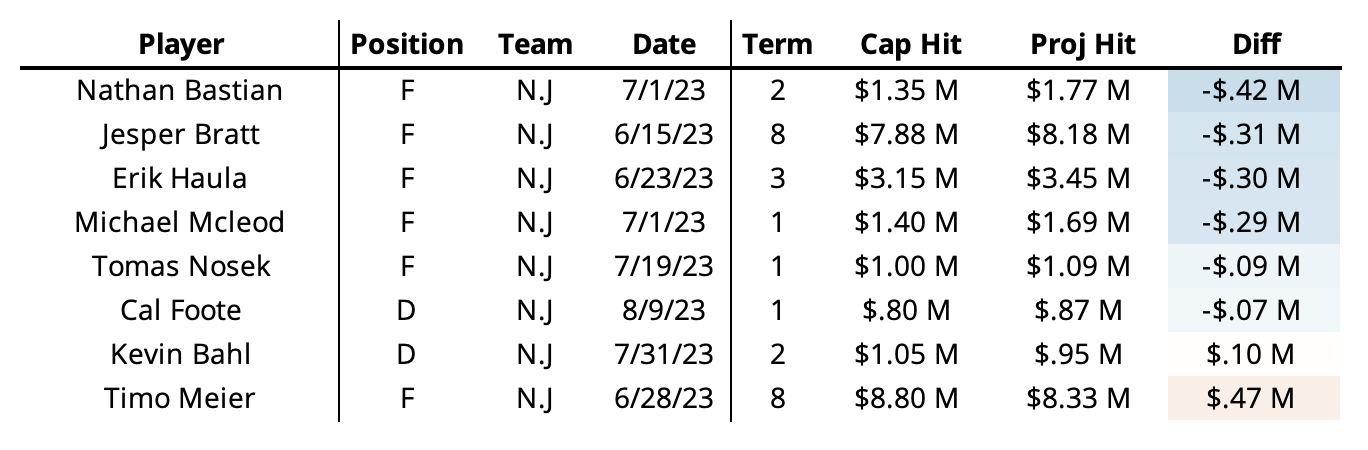
New Jersey “helped” the contract model the most of any team. Every contract they signed this summer was within $500k of our projection. We’ve always loved the New Jersey Devils (this isn’t actually sarcasm – if their round 1 victory and our extremely bullish projection for that series is any indication, we should be die-hard fans by this point). Even the Severson deal, which they technically “signed” was close to our projected value. Obviously, locking up Jesper Bratt at most prices is great, but the Devils got him at a slight discount. Securing Meier and a few other value deals rounds out a great summer in New Jersey.
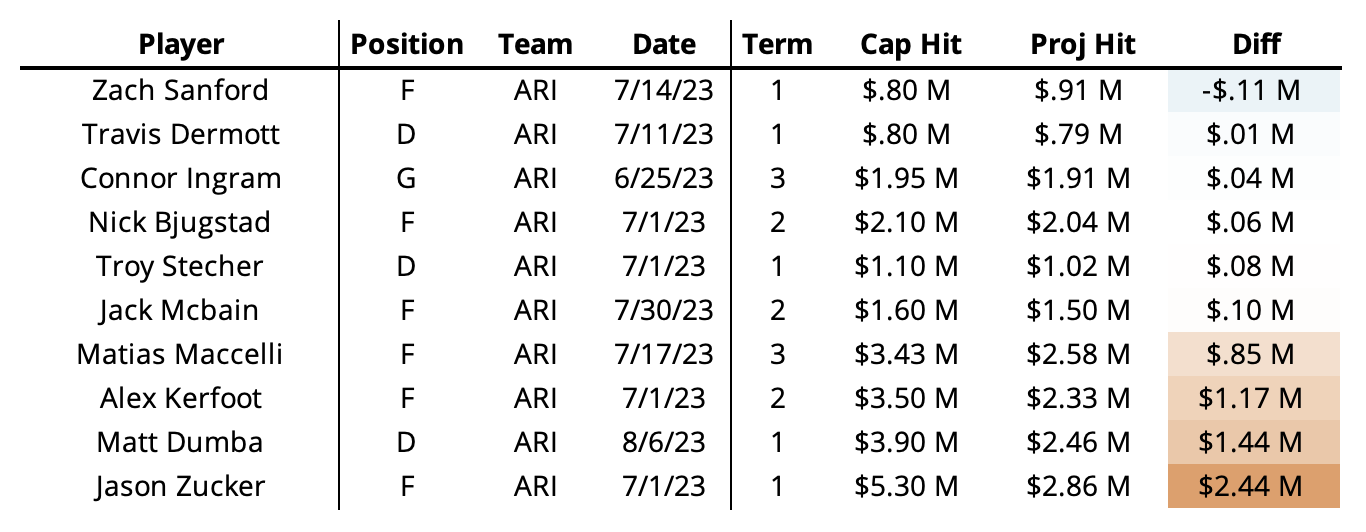
Now on to Arizona. Welp, the Coyotes are doing things. I’m highlighting them here because they show up as the second “worst” team in value added this summer, for almost the exact opposite reason the Islanders showed up as a “good” value team above. Matt Dumba and Jason Zucker’s 1-year deals proved hefty in comparison to our projections, and they also were about as unlikely as the Engvall and Mayfield deals (1% and 6% likelihood). Again, this weird summer strikes again. Kerfoot and Maccelli were signed to deals a bit over our projections, but these make a bit more sense given the Coyotes’ current roster and Maccelli’s breakout season in ’22-23.
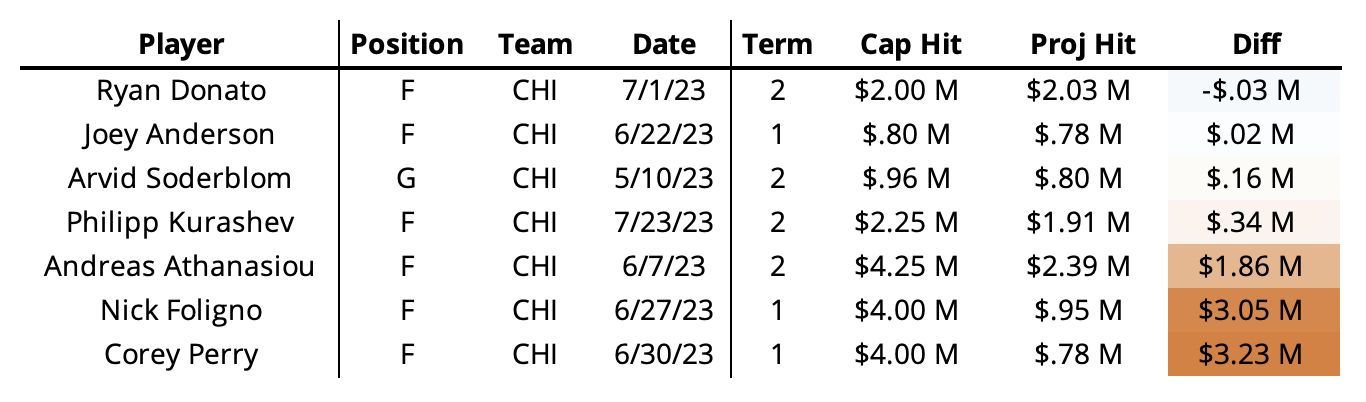
Lastly, we have my least favorite team in the league this summer because we only cheer for our models. The Blackhawks destroyed us with these deals. If we remove the Perry, Foligno, and Athanasiou contracts from evaluation, our R2 jumps to 0.828 and the mean absolute error drops by ~$40k. Just destructive stuff right there (although still not as bad as that damn Mark Giordano contract with Toronto from last year). It’s pretty clear the Foligno and Perry deals are a combination of cap-floor needs for Chicago along with some “leadership” qualities for their young players. It’s hard to really say the Blackhawks did a bad job here considering all their free agents were signed to deals less than 2 years. This is more me saying [Gob Bluth voice] come on.
Player Evaluation
Like our review last year, I find it interesting to compare contract value to our player projections (linked above) on the site. Note: we do not project goalie GAR, so we’re only dealing with skaters here. Sorry goalies.
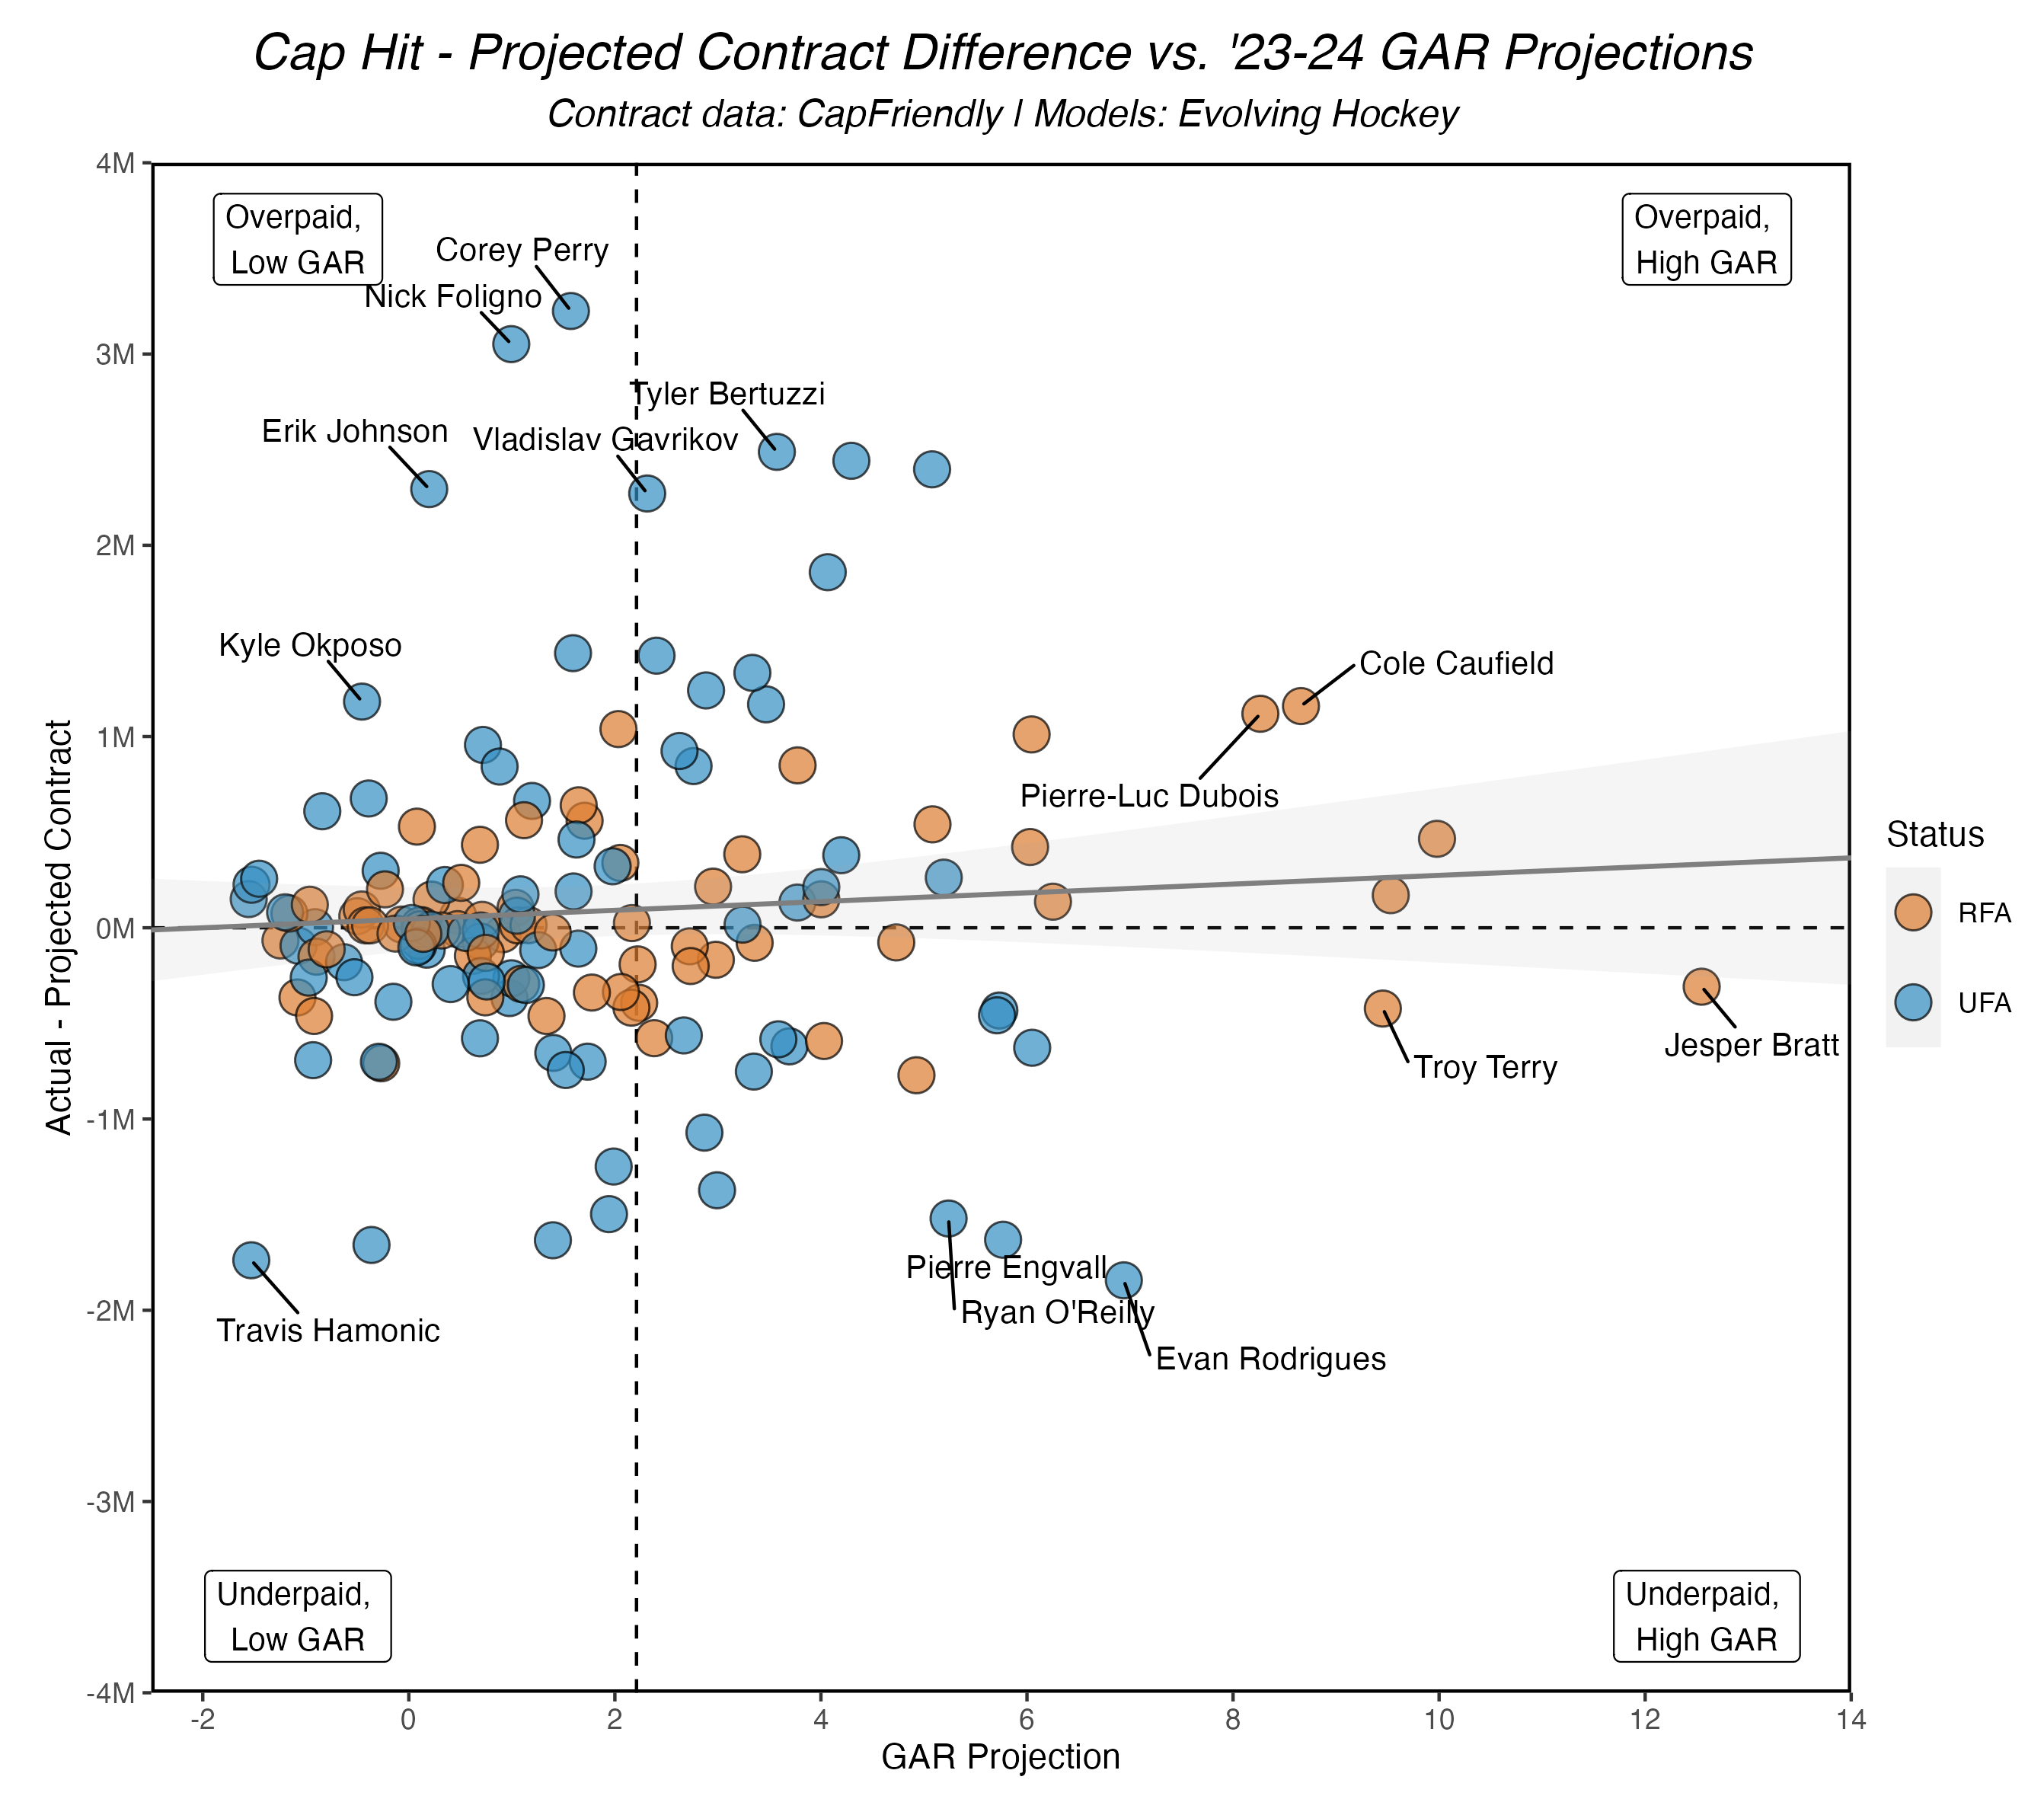
This chart is a little complicated (I struggled to describe it on the podcast lol). The x-axis shows our GAR projections for the ’23-24 season, and the y-axis shows the difference in a player’s actual and projected contract. While this may be a little counterintuitive, it gives us an interesting view of the trends in contract vs. player value (according to our models). For instance, last season we noted a trend where players with a higher GAR projection were underpaid, on average. This season, however, it’s much less clear.
What we see is a consistent group of RFAs paid within reasonable expectation towards the higher end of the GAR projection spread and a much more sporadic group of over and under-paid players below the GAR projection average. From this view, it seems teams may have slightly overpaid relative to projected on-ice value, on average. Now, this is very minimal, and it’s certainly not significant. However, this makes some sense if we think about the free agent class. Compared to previous years, there were very few high-end UFAs available. Teams, generally, want to “make a splash” and show that they’re attempting to “get better”. The available players, to a degree, seem to have had a little more leverage in the market, even if that leverage came with the small asterisk of “you’re not signing a long-term deal”.
Let’s condense the above into one last team analysis:
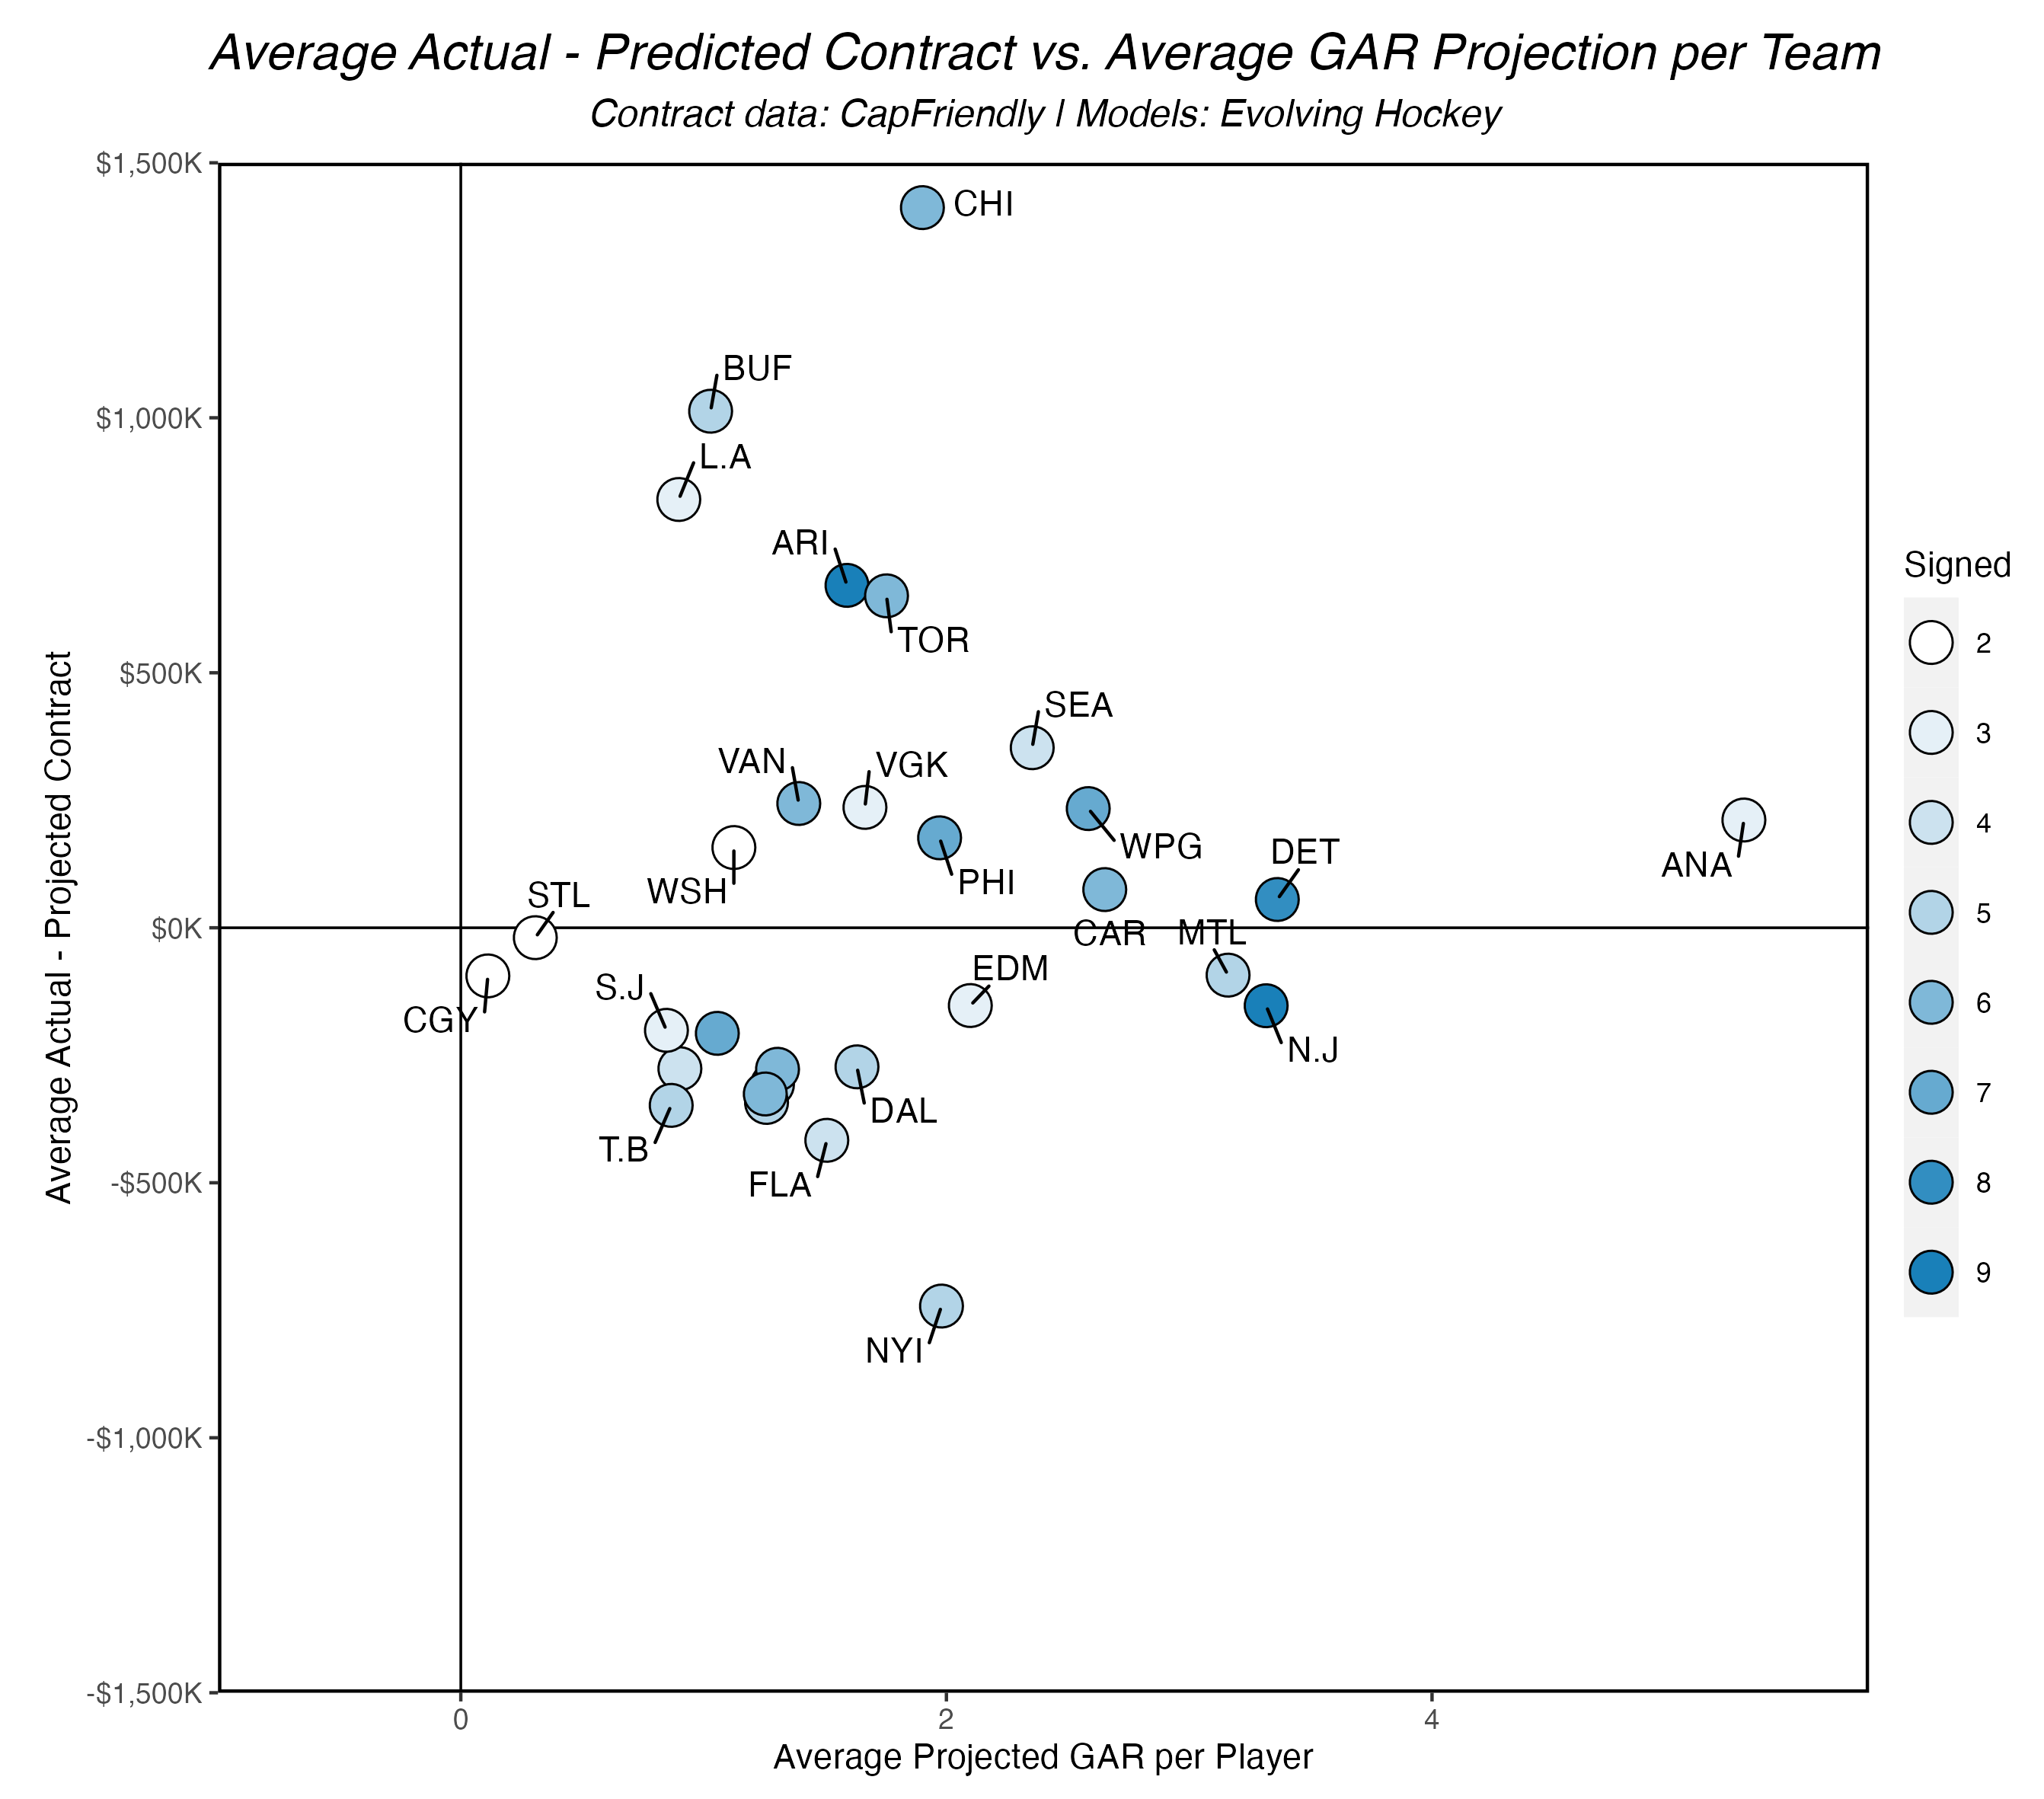
Here we see the same structure as the previous chart, but each axis is averaged per team. Again, I need to note the extreme lack of observations for each team. Anaheim is a good example of this. They signed three skaters to contracts above the league minimum, and one of them is a top-40 skater per our GAR projections heading into next season (Troy Terry). Alex Killorn and Radko Gudas round of the trio, and both have decent upside per our projections. Chicago and New York, as covered above, standout as well. Buffalo had an interesting season. Of the 5 skaters they signed, only one (Connor Clifton) was signed to a deal longer than 1-year, and no player signed for more than $3.3M (Clifton as well). Buffalo is clearly still in rebuilding mode, albeit late-stage rebuilding, and it wouldn’t surprise me if they make some additions throughout the season if the team plays well. Of note, Minnesota and Columbus only signed 1 player (although the Blue Jackets did acquire Damon Severson in that sign-and-trade with New Jersey), and Washington and St. Louis signed 2 players. In general, fewer teams added players in free agency this summer compared to last summer. This also makes sense given the current environment.
Finally, let’s look at the most “under” and “over” paid players with our GAR player projections shown in the last column:
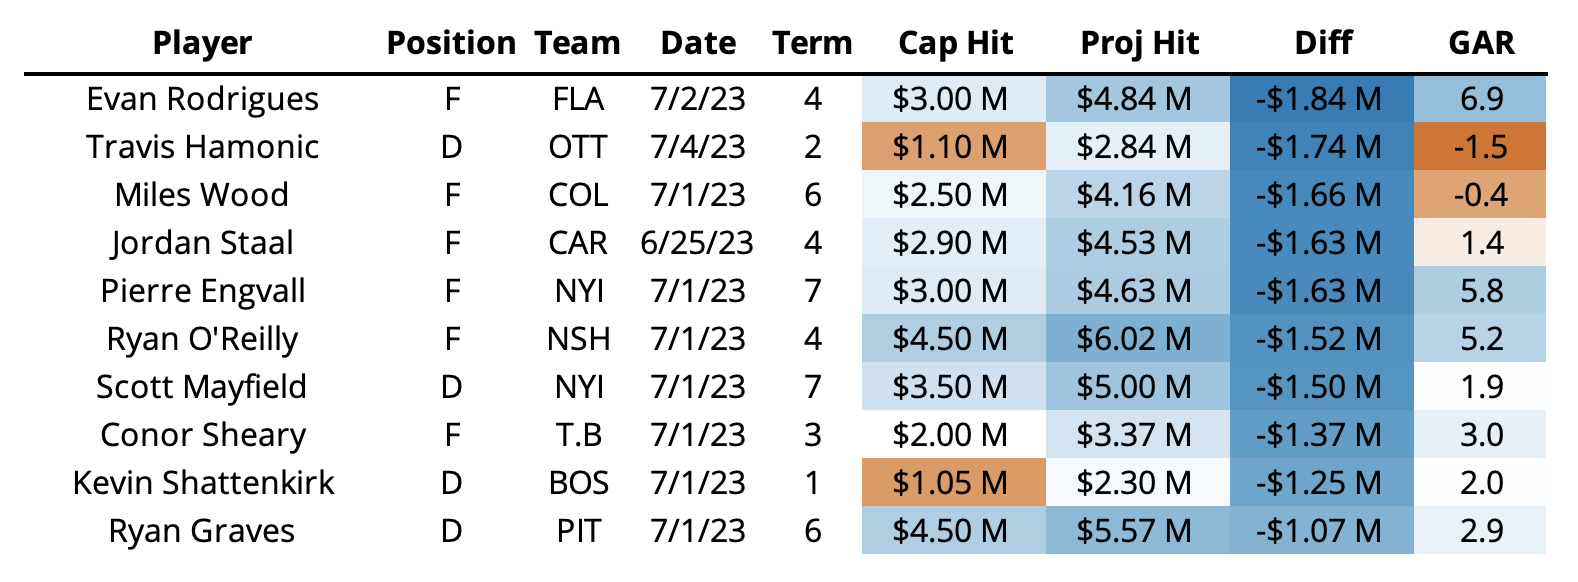
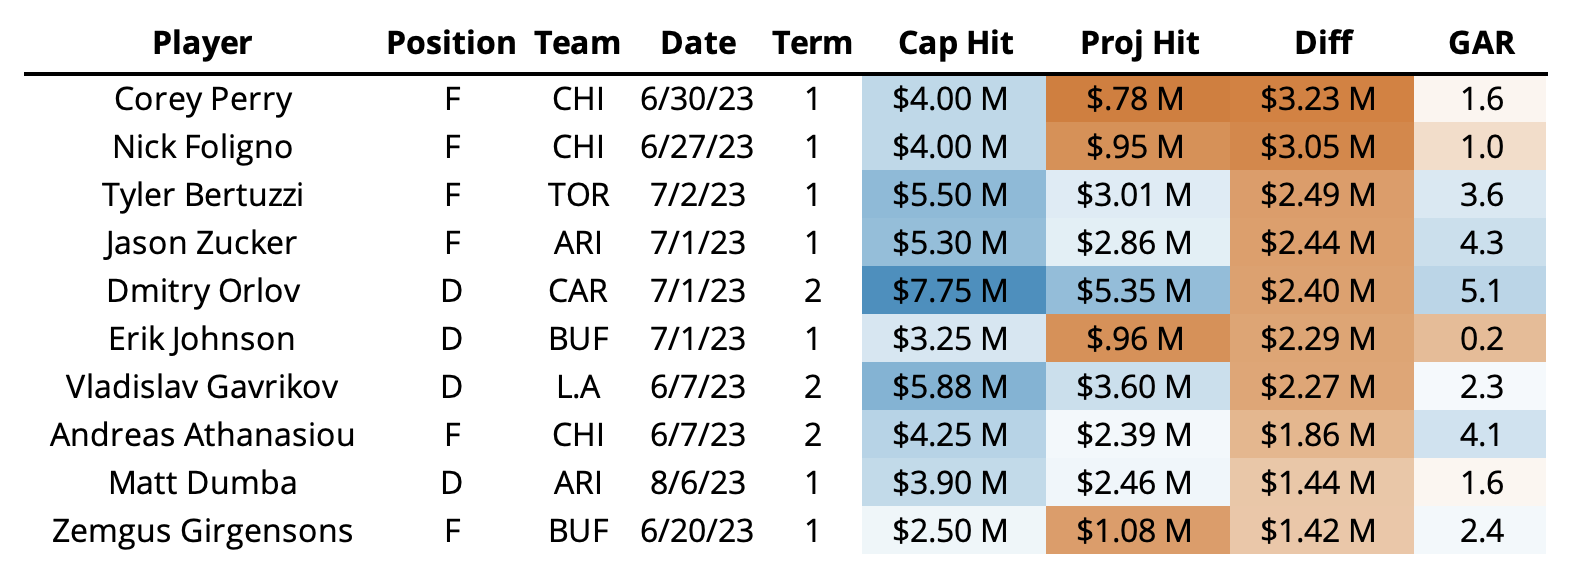
I think these tables may summarize this offseason better than anything else. In the first table, Hamonic and Wood show up as two of the “best value” players while projected below replacement level. On the flip side, we have some extreme overpayments, but no contract here is longer than 2 years. Evan Rodrigues, an Evolving Hockey star, sits at the top, and for good reason. Florida really got a steal there. But possibly the most surprising name is Kevin Shattenkrik. Many years removed from his prior analytics darling heyday, the 34-year-old defensemen still grades out quite well, and Boston got him for a great deal.
Wrapping Up
So yeah, this was an offseason. I’d like to be able to say something substantial about the market, about whether anything has changed in how teams evaluate players from a contract and value standpoint, or even if the salary cap will have any impact on the next summer. However, I’m left with a feeling of “we might as well just throw a lot of these contracts away because we’re never seeing them again”. That said, the Giordano and Bergeron deals from last summer were included in the model, and I’m not sure we saw any kind of major impact from them. One thing is certain – I don’t think players like Corey Perry and Nick Foligno should expect to get $4M per year in the near future, unfortunately (but who knows!). However, one thing I do know: next summer is going to be insane. Right now, we have more than 20 extension-eligible players projected at >$7M per year deals, and the majority of those players are UFAs. We’re certainly going to see a few players extend from now through the end of next season, but considering we only projected five players to sign over $7M this year, it’s going to be quite the summer in 2024. And the fine folks at Evolving Hockey dot com can’t wait!