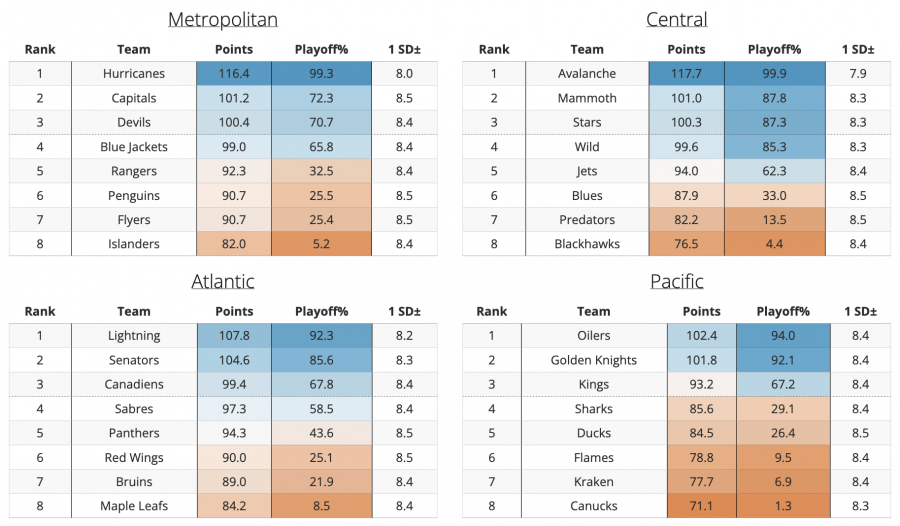
While most people are still recovering from the punch in the face that was 2026 Free Agency, some of us (ok maybe just me) overlooked the start of the season while still pondering what the hell Vancouver was doing signing Zeev Buium to almost $10M or why numerous NHL teams decided to disrespect our contract projections this summer. In reality, the NHL season starts a week earlier than it did last year to account for a new feature! 84 games! Woowww, woopppiieee, a zeppelin! I’m not sure who in those NHL offices decided it was a good idea to do this in the middle of prime fall-planting time, but Luke and I can adapt and change just as well as anyone else (aka we’re still planting, I’m just sore). The NHL season starts tomorrow. This ended up getting kind of long like everything we do, so I’m going to skip being any more funny here because I’m a hoot below – I also cover how adding two games to a season changes the projections relative to every other year we’ve done this, so I don’t need to do it here. Ok, enough rambling. Let’s get into it.
Model Info
This is an updated version of our explainer from the previous description here.
Our team probabilities are generated in a three-step process. We use a model to project “future” value for all players, use these player projections to build a game probability model that projects the winning % of any given team matchup using logistic regression, and then feed these individual game probabilities into a Monte Carlo simulation that generates the outcomes for all games in a season. To complete this process, each team’s player projections are aggregated into Forward, Defensemen, and Goalie groups, and various metrics are used for each group which are then fed into the game probability model. With these inputs, we can generate home and away team winning percentage values. Once we have all home/away probabilities projected for each game in the season, we prepare the simulation.
For each game in the simulation, we only care about the projected winning % for the home team. Take a game between a home team and an away team. The process laid out above gives us a winning % for each team. We replace the away team’s projected probability with a random % between 0 and 1. If the home team’s projected winning % is higher than the random number, they “win” the game (they “lose” if it is lower). This is done for each game in the season and then repeated tens of thousands of times. Once the simulation is complete, we check how many times each team won a game, sum the total games won, and arrive at each team’s projected point total.
The first step is generating multiple player-level models, which produce ratings for all players in the league. For skaters, we found our xSPAR metric (Expected Standing Points Above Replacement) as well as a custom “game score” model (built using Box Score metrics) works best for predicting future team game outcomes. Our SPAR and RAPM metrics were also tested but they did not perform quite as well for this specific task. The “game score” model we are using is similar to Dom Luszczyszyn’s Game Score model; however, we tested various box score metrics and weighted them through a “grid search” approach to optimize predicting future team game win probability. For the simulation, we set the schedule for all teams, add in the projected game probabilities, and then run the simulation.
We still use a roster-level system, project various metrics for every player for next season (notably xSPAR and our own “game score” metric), determine the roster for every team*, aggregate those individual projections into team ratings for forwards / defensemen / goalies, and compute game probabilities for every game in the ’25-26 schedule. We then run a Monte Carlo simulation 50,000 times with all of that in place to project point totals for all teams in the league. As the season progresses, this simulation is re-run daily with updated data.
* For the ’26-27 NHL season, we are now tracking and setting rosters ourselves. In prior years we’ve used rosters in collaboration with other sources (CapFriednly, NHL Rosters, etc.). While it took quite a bit more work to set this up, we’re now doing this in-house and are happy with how it came together. We’ll try to note any significant injuries in the previews below. Please let us know, throughout the season, if things seem off or if we’ve missed something.
Team Projections
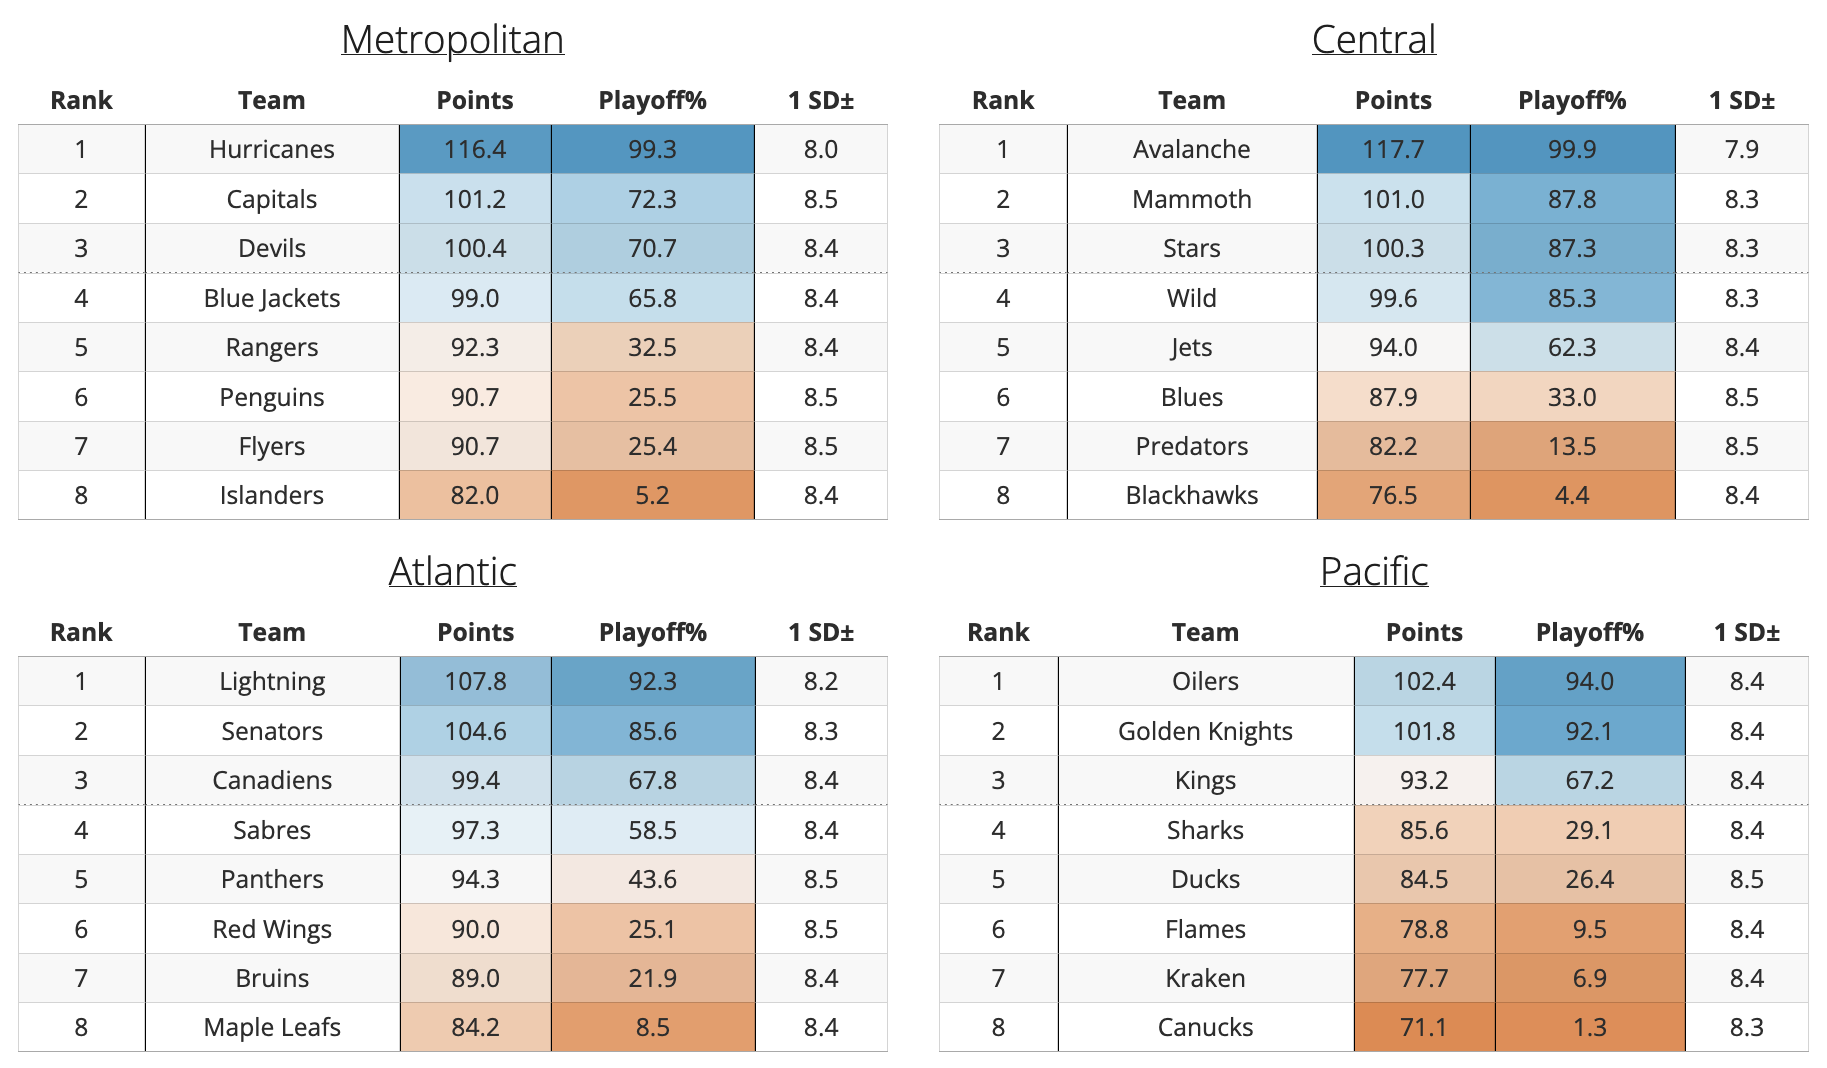
[This paragraph also taken from last year] For those familiar with our Team Projections on the site, these are updated daily as the season moves along. We attempt to account for injuries to the best of our ability based on “expected” return dates and anticipated substitutions, but there is always uncertainty when it comes to missed time in the NHL. As of right now, we’re using our own (noted above) rosters along with our best estimate for when injured players will return in the season and who will likely take their place during their absence. Ok, onto the team discussion. Division medians:
- Metropolitan: 95.8
- Atlantic: 95.8
- Central: 96.8
- Pacific: 85.1
[self-plagiarizing complete] The first thing we should discuss here is the increase in total games in the season. Starting this year, every team will play 84 games (up from 82). Because we use a simulation to arrive at our final point totals for teams, all we need to do is add two more (or rather, let the schedule add two more) games, and then run the simulation like we normally would. With an 84-game schedule, there will be an additional 64 total points available for any given team (regulation or overtime win) as well as an additional 7-10 points awarded via losses in overtime/shutout. The overtime rate increased from 20.7% in ’25-26 to 24.9% last season, which is where the 7-10 points comes from. This season, we’re projecting a total of ~2994 points, which is almost 100 more standings points than we projected last year. Roughly 72 of those can be accounted for by the additional two games, while the remaining 28 come from the distribution of and expected changes to team strength (among other factors).
Interestingly, heading into last season we saw a 14-point total decrease from our projections in ’24-25. Heading into this season, it appears we’ve course corrected a bit: we’ve now increased, somewhat theoretically, by 14 points relative to ’24-25. One of the main reasons for this population improvement is that many of the “bad” teams from last season have improved, some quite a bit, even, relative to what we expected a year ago (MTL up 12, S.J up 14, CBJ up 13, etc.). In addition, the “good” teams have stayed relatively good (COL, CAR, T.B, DAL, EDM). Every team is going to “improve” here because an extra two games mean the hopes and dreams of four more points, but across the board, our combined models and the simulation are more confident than they were last year in a general increase in team strength throughout the league.
It’s helpful here to consider what 84 games means for every team relative to prior years. On average, with every team held equal, we would expect each team’s standings points to increase by about 2.25 (increase in total standings points by 72 divided by 32 teams). If we project a team to be >2.25 higher than we did last year, it’s fair to say the model thinks they’ve improved. If they’re less than that, they’ve gotten worse. If they’re Vancouver, what the hell is going on. In all seriousness, it’s not exactly that simple since every team can’t be “held equal” because not every team is equal, but ~2.25 points gives us a handy reference point for this. If we follow this line of thinking while keeping last year’s projections in mind (link above), the Metro and Central have significantly improved, the Atlantic has stayed about the same, and the Pacific managed to get even worse.
Metropolitan Division
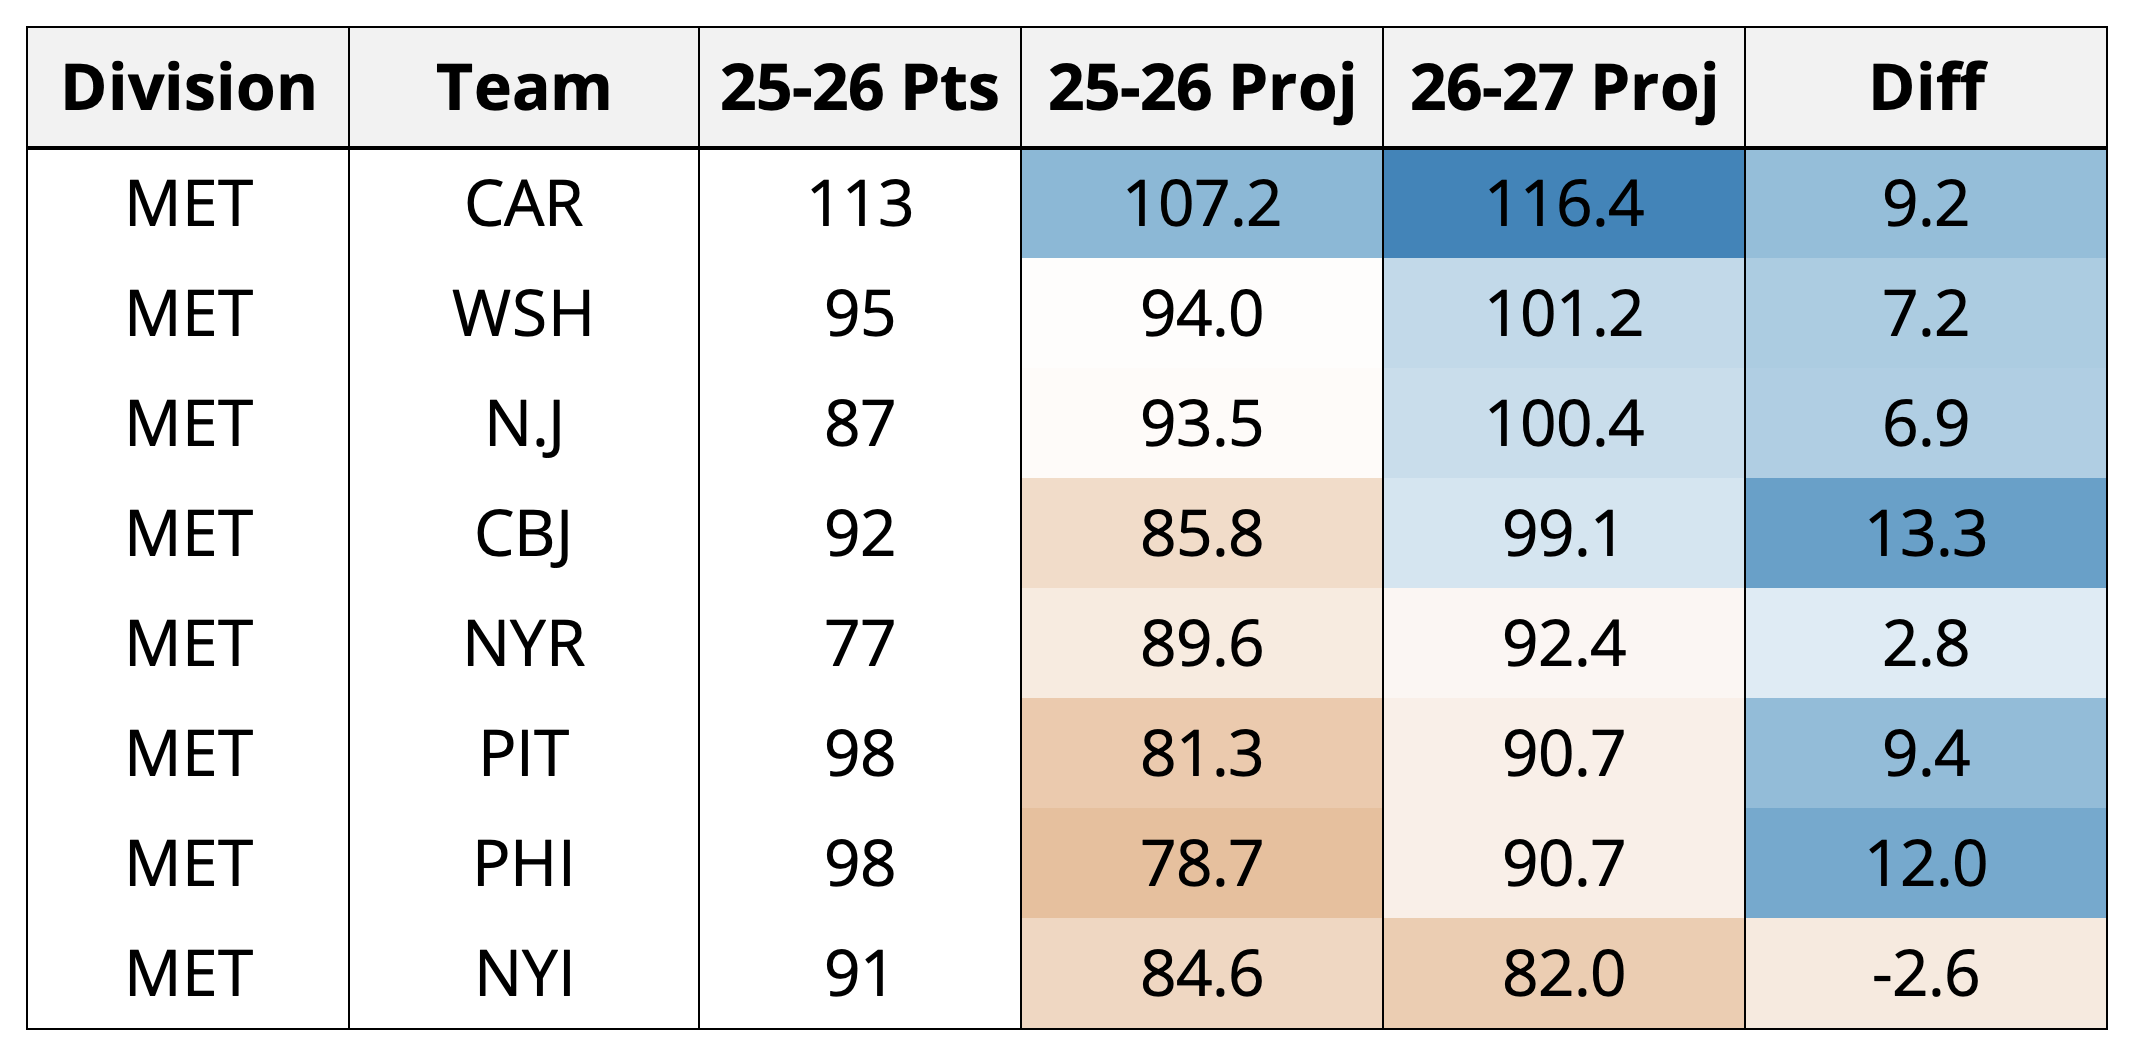
It’s hard not to start off talking about the Hurricanes. On the heels of their first Cup win in 20 years, they enter the ’26-27 season with the second-highest projection here. Interestingly, they stayed very quiet this summer – based on our tracking, five of the seven contracts they signed this offseason occurred in September, and only Kochetkov signed for more than $1M per year. While they did bring in a few new players, their roster is set to look very similar to the one we saw in the playoffs. The only real question for the Canes is goaltending. With the departure of Freddie Andersen (now an Oiler), there’s a lot riding on Bussi and the aforementioned Kochetkov. Behind them in the standings are three teams that we all knew would be here, right? Washington, New Jersey, and Columbus round out the top four in the Metro. The Devils may be one of the most interesting teams in the league. After a dismal campaign last season finishing 7th in a division that was sort of asking for teams to be better, we’re now projecting them to finish with over 100 points. New Jersey has been busy this summer, but like Carolina it’s been at the margins. With nine players signed in free agency, only one was a UFA that signed for more than $1M (Mantha). Their crowning achievement, however, was the acquisition of Luke Evangelista from the Predators a few weeks ago. A skater we picked as a top-5 Selke finalist last spring, the 24-year-old might be one of the most promising young two-way forwards in the game. His subsequent $7.25M five-year extension may seem a bit steep, but we at Evolving Hockey always celebrate when defensive forwards are given really good money (I mean, it was only like $800k over our extension projection, and given the summer we just went through, I’d say that might actually be in line).
On the other end of things, the Islanders enter this season as the only team in the division with less points relative to our projections from last season. After a middling 91 points in ’25-26, they did very little this summer to change anything other than re-sign Tony DeAngelo because you really just need to have him back on the team and lose Anders Lee (who is still actually really good even accounting for age). The only hope this team has is in Sorokin, who finished last season with the 4th most GAR per our model (behind Thompson, Wedgewood, and Swayman). Both Pennsylvania teams improved, but neither is projected to challenge for much other than another first-round matchup (which I would love to see, for the record). The Flyers enter ’26-27 as possibly the most entertaining in the division with numerous players that might end up on various Evolving Hockey awards lists. Regardless, the Hurricanes are going to be a hard team to beat, and few other teams in the Metro seem up for that task.
Atlantic Division
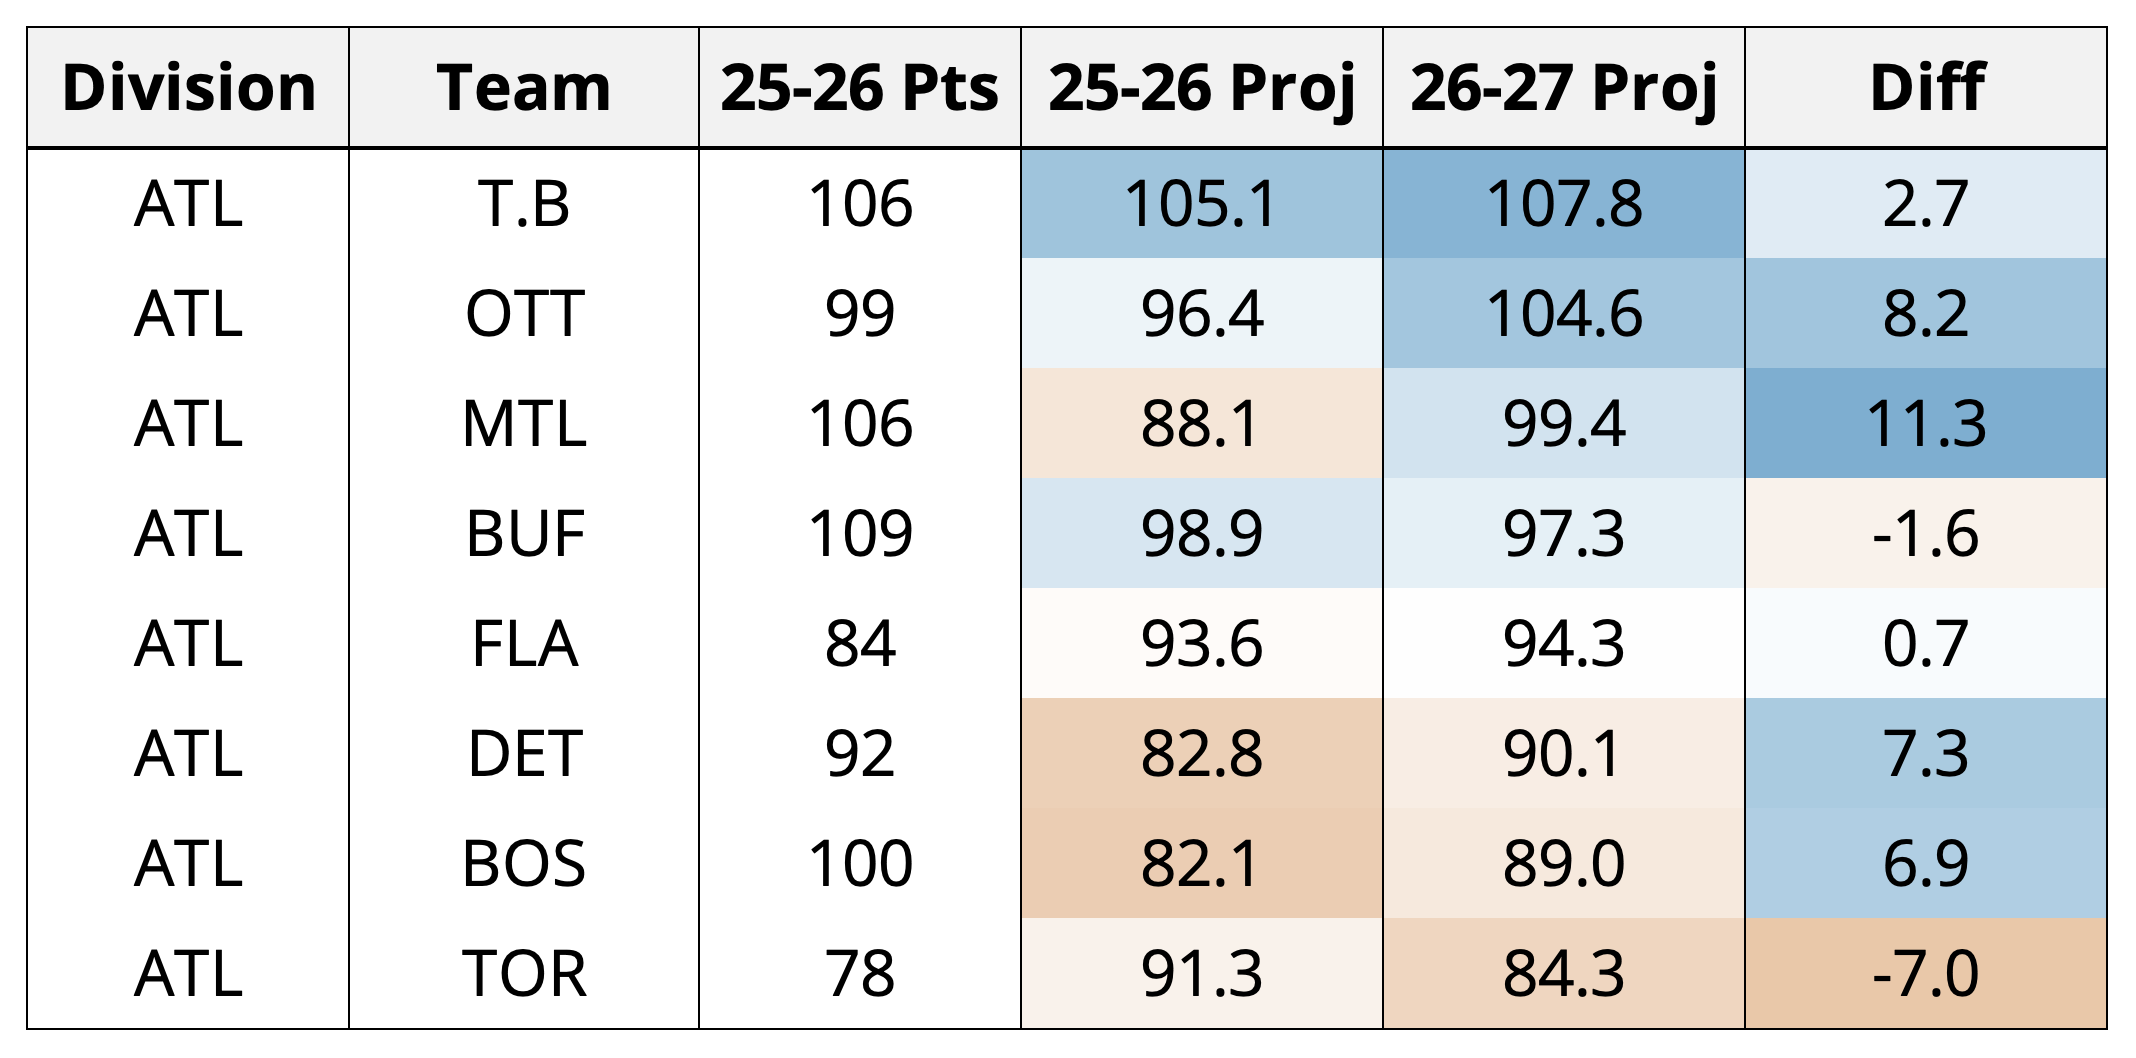
Same as it ever was, except Toronto got real bad. Every year there’s a team that we, for whatever reason, project much higher than other models. This team ends up becoming “our team” for the year. Last year it was the Sabres, in prior years it’s been the Devils or Montreal or somehow the Kraken. It seems Ottawa is first in line this year. The Sens finished the ’25-26 season with 99 points, the 3rd highest xGF% at EV (behind only COL and CAR), and four players in the top 50 of xGAR. Specifically, Jake Sanderson has emerged as one of the most promising young defensemen in the game, leading the team in xGAR last year. With the extremely surprising two-way development (?) of Cozens, a phenomenal year from Jordan Spence, and continued improvement from their young pieces, Ottawa has a lot going for them not even accounting for the healthy hate-fuel burning from the departure of Brady Tkachuk. Unfortunately for many of our great friends in Canada, it seems the French-speaking regions are set to dominate this season. While 2nd in the Atlantic with a projected 99 points isn’t necessarily an impressive feat, Montreal has slowly been building one of the most cost-effective young teams in the league. With an average age younger than every team save the Rangers and Blackhawks, the Habs enter ’26-27 with one of the best young cores in the game. I’m going to avoid the Leafs comparison from 7 or so years ago, but if they can learn from those mistakes, it’s hard not to see how a team led by Caufield, Hutson, and Suzuki with their contracts doesn’t succeed long-term. That said, their lack of depth and slight uncertainty in net prevents the point total from rising.
From there, I must get a little sad. The EvolvingWild twins are being forced to talk about the Buffalo Sabres in a way that won’t make everyone in Buffalo love us. Although, I think it’s fair to say that 109 points and winning the division was one of the wildest things that happened last season. We’re projecting a slight drop in the standings relative to our projections from last year: a good chunk of that can be attributed to the loss of Tuch, not much improvement in free agency (did anyone really get better?), and a healthy amount of uncertainty in net. UPL and Lyon are both currently dealing with injury issues and have been wildly inconsistent in net over the last three seasons. For all we know, Hellebuyck might be Buffalo’s starter for the majority of the season. Which brings us, somewhat appropriately, to the Maple Leafs. I know I said above that I was going to make fun of them, but I mean, is it necessary? They finished last in the Atlantic with 78 points, made some questionable hires, signed a 38-year-old goalie as their number #1, and filled the rest of their lineup with 30-year-old depth players. Sure, they added Raddysh, but very few of their additions this summer inspire joy. Even without those, the core has struggled the last few years, not to mention their goaltending. I hope Matthews gets better because the league is so much more fun when he’s good.
Central Division
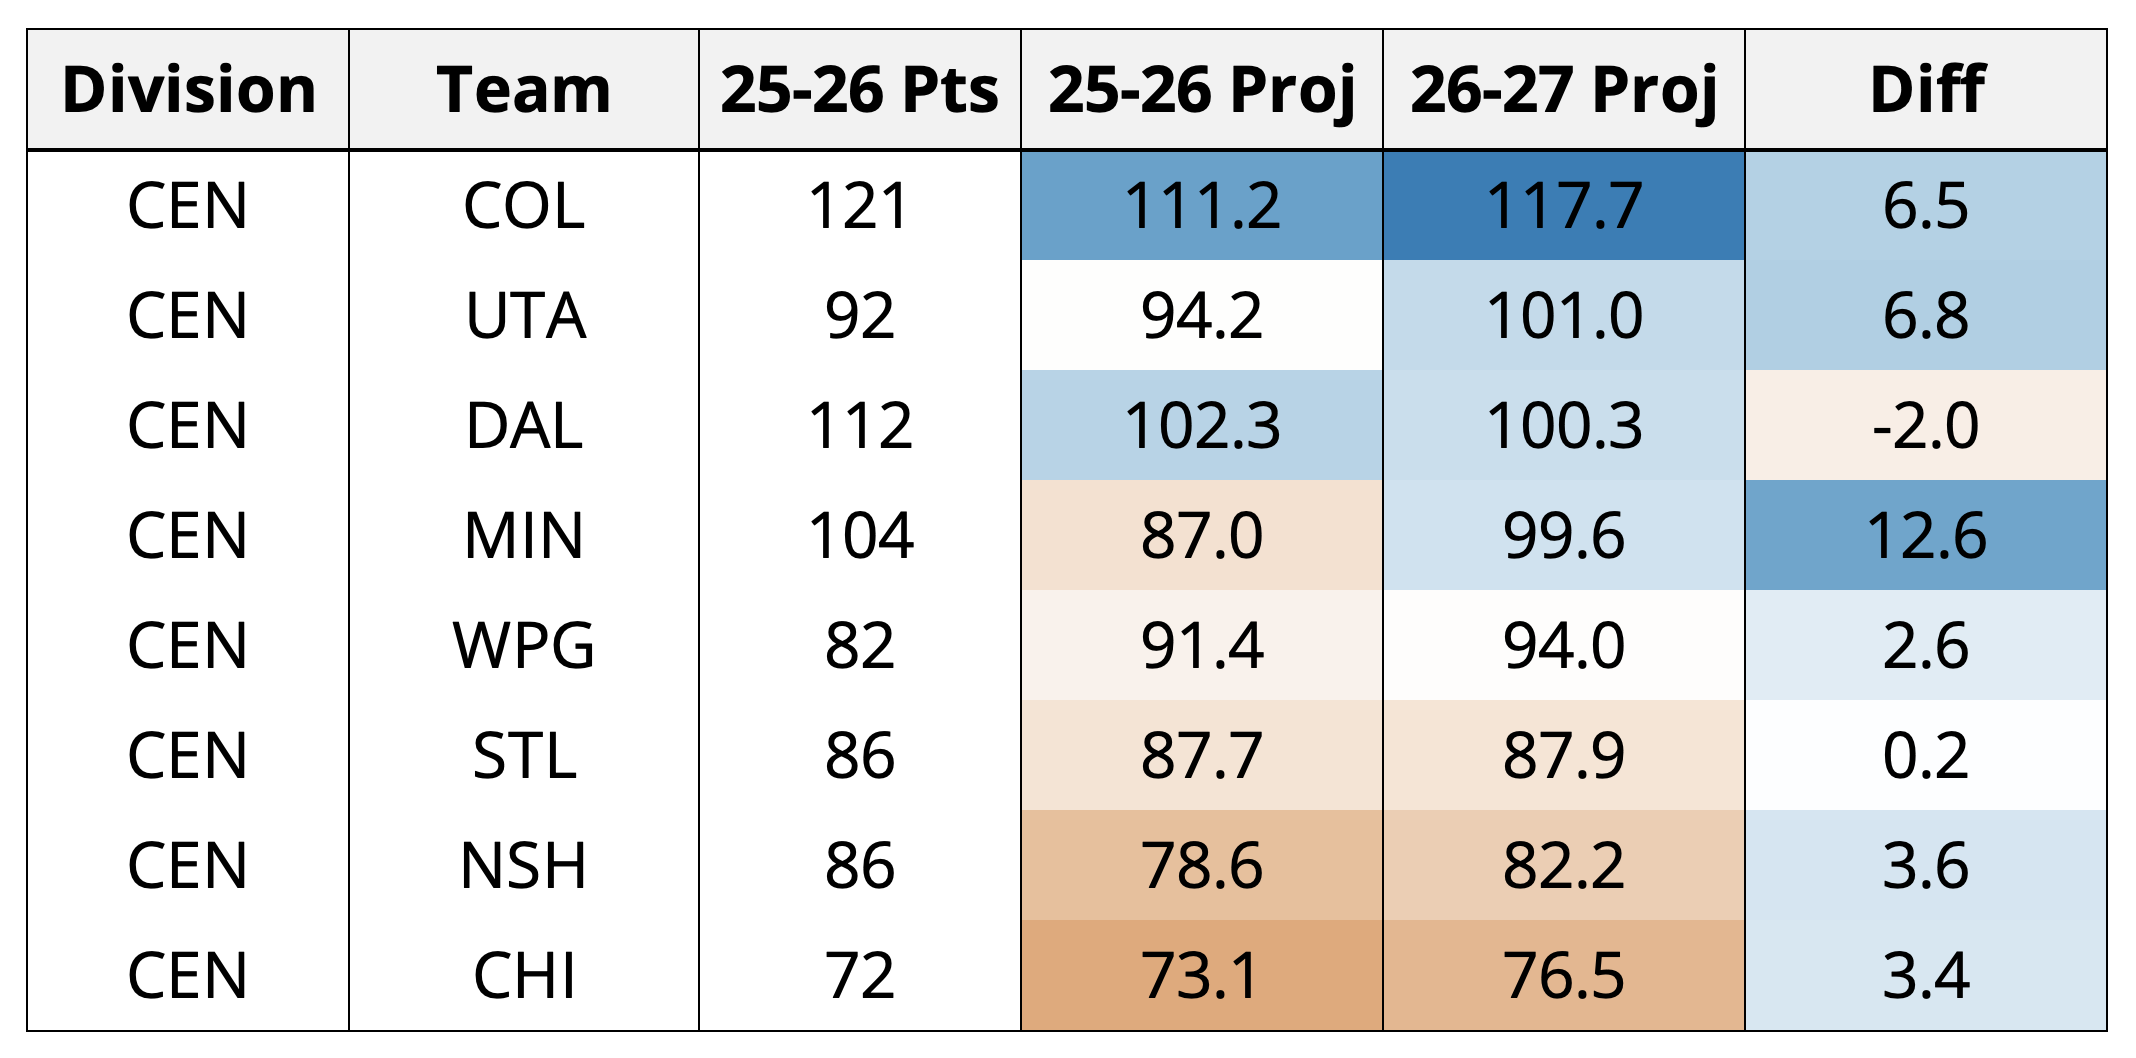
Ok, now we’re getting to the good stuff. It’s the time where I get to talk about how the Minnesota Wild are definitely going to win the Cup this year. Or, well, mayybbee? Quinn Hughes is doing a lot of work here, and if they lose him to New Jersey (I think it’s a fair assumption), things could get bad quickly this winter. Don’t get me wrong, the Wild have a team filled with strong top-line/pair pieces, the rare “both of our goalies are too good to pick a starter” problem, and several aging players who have successfully transitioned to lower roles in the lineup. The problem here lies in their depth (teams don’t need third or fourth lines), and for a team with such a top-heavy makeup, problems could arise quickly given one injury or the best defenseman in the league wanting to play with his brothers. I want to believe, but Scully is challenging me here. Utah, however, is rostering no players with siblings, so they won’t have to face these kinds of problems. While they have some of their own issues (Stenlund, McBain), the Mammoth have turned themselves into a team vying for contender-status in the Central relatively quickly. Finishing with the 4th highest CF% at EV last season, very solid performances from their veterans (Schmaltz, Carcone, and Schmidt), and even more promising results from their young guys (Guenther, Cooley, and But), Utah heads into the season with high hopes from the EH boys.
Colorado is boring because we talk about them every year, so I’m not going to talk about them because as a longtime Wild fan it still irritates me deep down inside. Let’s talk about the, umm, I guess the Stars. As the only team to see a drop in projected points compared to a year ago, this makes more sense from a narrative perspective than it might from a numbers perspective, which is more me saying why are they disrespecting Jason Robertson this way? Over the last four seasons, only McDavid, Draisaitl, and MacKinnon have produced more xGAR than he has, and they decided to let him go to arbitration. The Stars are still quite a good team, and it will not surprise me if they prove us wrong here. One of the more interesting results we’ve seen both here and in our fantasy projections is Jake Oettinger. For some reason, our models are fairly confident that he’ll be markedly worse than he was last season, which is definitely driving some of this. I’m mostly stating this now so I can screenshot this in three months when he is [insert really good/bad], but there does some to be some kind of potential trend given his down year in ’23-24 and his age. Either numerous goalies have done the exact same thing and been bad in the season that Oettinger is about to have, or goalies are weird and even the models don’t know what’s going on.
Pacific Division
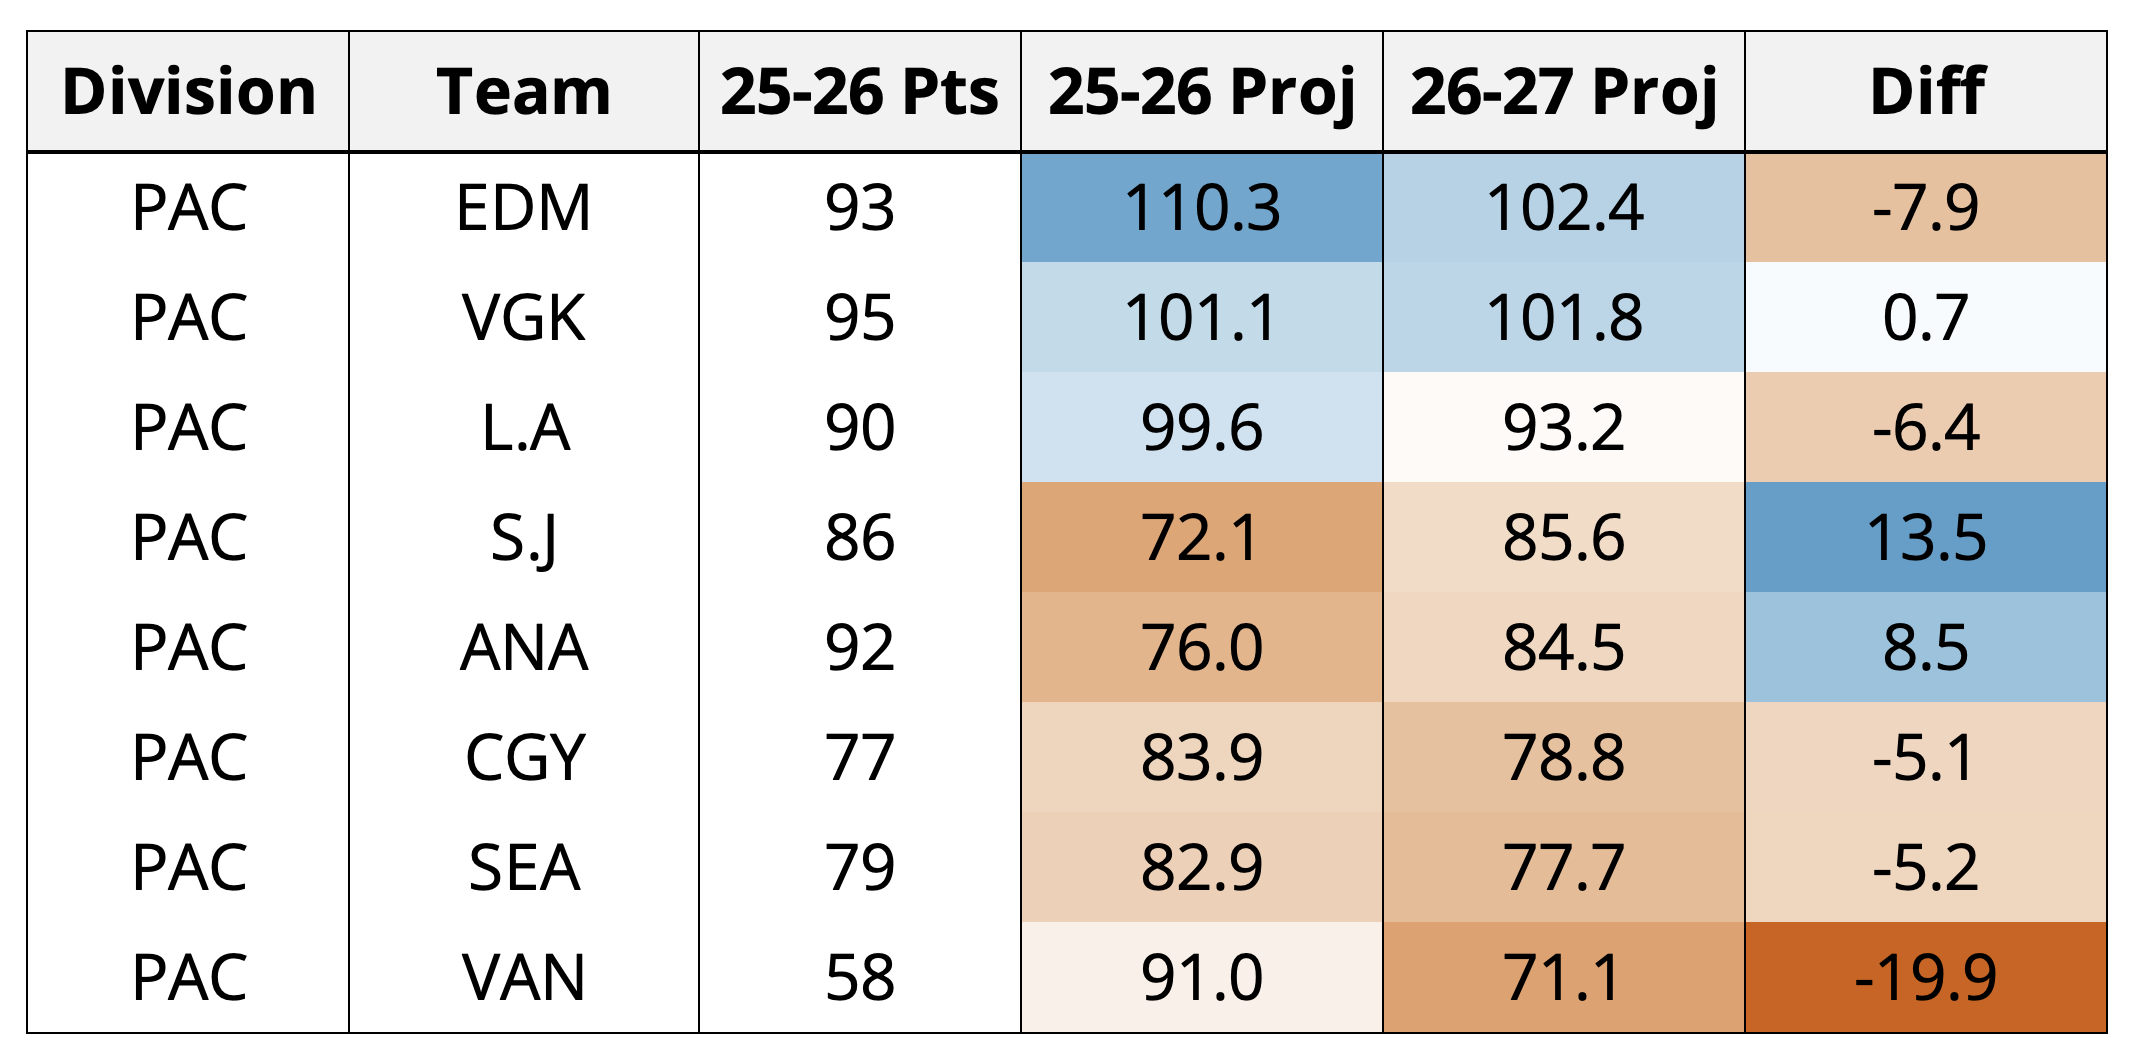
The Pacific division. Ah, what a treat. It’s not good, but boy do we love it. More than half of the teams here have gotten worse relative to what we projected last season, and that’s not even accounting for the new free points they’re going to get with 84 games. While the Ducks’ UFA additions consisted of role-players more than anything else (Greer, Jensen, Malott), their RFA signings (Carlsson, Gauthier, Mintyukov) told us a lot about the kind of team they’re trying to become. The Ducks locked in $39M a year for three 21.7-year-old players over the next 5-6 years, which is almost certainly more relevant for the impact on the market than it is for the Ducks. Anaheim enters the season with the 4th youngest team in the league with a surprising amount of depth given everything that’s occurred there in the last five years, and even if they committed to historical overpayments, they’re in a division that is just asking for someone to be good; the Ducks may just be the team that fills that role. The Sharks, however, decided they’d rather morph into a Typical Hockey team this summer. With the additions of Trouba and Nurse, I think the Sharks may have come out of this summer worse off than they would have if they did nothing. Still, no team has improved more compared to a year ago per our model, and you do have to give them credit for that. 86 points isn’t much to rejoice about, but Macklin Celebrini might just be the most entertaining (and promising) skater in the NHL right now. Graf, Smith, and Chernyshov fill out a top end that’s barely (or probably not) old enough to drink while also being the best players on the team. That’s hard to do. The Ducks and Sharks continue to be “must watch hockey” for the truly deranged hockey fans.
The Edmonton Oilers. No team finished with less points than we projected last year, and somehow they weren’t the most disappointing team in the league, even after losing to teenagers in the first round. Edmonton has three players who finished within the top-20 xGAR last season (McDavid, Draisaitl, and Bouchard), and still would have been a wild card team in every other division. Frankly, I don’t know how that happened, but if I just take a quick little look at our Standard Team tables I bet I can get a sense of what went wro… oh. Seems like the lowest EV Save % in the league might have something to do with it? The Oilers have a trio of skaters that rival any other team, a good supporting cast of young depth players that should contribute in a division that is quite weak, and three rostered goalies who combined for -12.3 total GAR last season. Goalies are hard to predict, but I mean, are they that hard in this case? While we’re on the subject of disappointing results, the ’25-26 Canucks season may just be the most disappointing season any team has had in over 20 years. I don’t really want to dwell on it too much, but man. Like last year, the Pacific division is actually the Wild West, and with veteran teams like EDM, VGK, and L.A sitting at the top and very young, up and coming chaos looming below, I’m not sure there’s another division that will provide more entertainment than this one.
—
Ok that’s it. I hope the next year is extremely fruitful for you, your favorite team wins the cup, and everything we said here comes true. Or at least some combination of all of those things. A new NHL season is upon us once again. Thanks so much for sticking around after all these years. It’s kind of insane that we’re still doing this – we’re extremely grateful to still be able to do this for everyone who subscribes, reads, and follows us. In the eternal words of Sean Rash, let’s have some fun.
- Josh & Luke