Rosters from CapFriendly’s Depth Charts. Data from Evolving-Hockey.
Round 1 of the 2022 NHL playoffs was one of the most enjoyable playoff rounds any of us have ever watched. Five of the series went to game 7. Jake Oettinger arguably played better than any goalie has in a playoff series in the last 15 years, the Leafs lost in the first round again, and the Avalanche absolutely crushed the Predators. It’s hard to summarize the 2022 first round because it was just that good. Despite our reputation of not watching the game (Luke and Josh speaking here), we watched more hockey in a two week span than I think either of us have ever watched.
The second round is set up to potentially top the first, which seems absurd. The Battle of Alberta. The Battle of Florida. The Battle of can Igor Shesterkin carry the Rangers to another series win. And I guess the Avalanche being extremely good but the playoffs possibly happening? I for one can’t wait. Here’s what happened in round 1:
| Division | Home | Away | Round 1 % | Outcome |
|---|---|---|---|---|
| Atlantic | FLA | WSH | 83.7% – 16.3% | 4-2 |
| Atlantic | TOR | T.B | 53.0% – 47.0% | 3-4 |
| Metropolitan | CAR | BOS | 48.0% – 52.0% | 4-3 |
| Metropolitan | NYR | PIT | 56.3% – 43.7% | 4-3 |
| Central | COL | NSH | 88.4% – 11.6% | 4-0 |
| Central | MIN | STL | 66.5% – 33.5% | 2-4 |
| Pacific | CGY | DAL | 86.9% – 13.1% | 4-3 |
| Pacific | EDM | L.A | 72.7% – 27.3% | 4-3 |
Eastern Conference
Florida Panthers (1) vs. Tampa Bay Lightning (3)
73.7% 26.3%
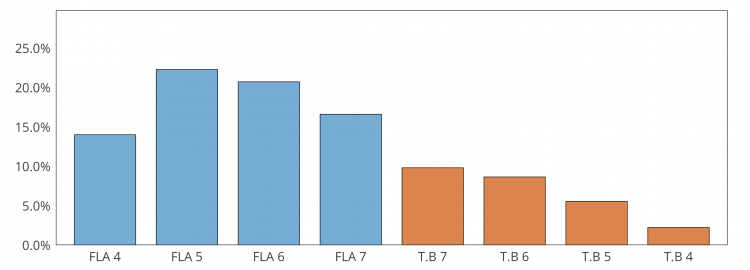
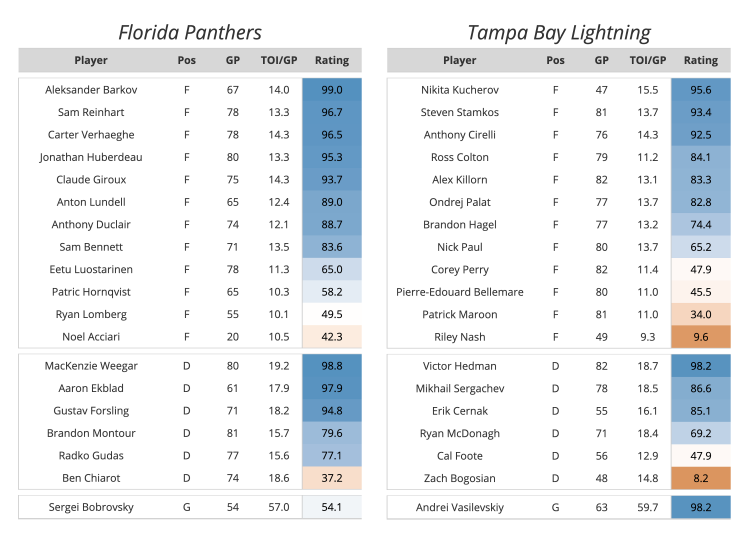
The regular season champions didn’t have as great of a first round as they would’ve hoped. After losing games 1 and 3, the Cats came back from a 2-1 deficit to defeat the Capitals in 6 games. All credit to the Capitals, they were able to drag the Panthers offense down just enough to make them look human. The Panthers only had a 56% share of shot attempts and a 52% share of expected goals at 5v5. They also failed to score on just under 34 powerplay minutes, making them the only team this playoff season without a goal on the powerplay. They have a much more difficult opponent this time around, but we still feel the Panthers have a good chance to take out the Lightning this round.
The Lightning are coming off one of the closest playoff series we’ve ever seen. Adjusting for score and venue, the Lighting had a 49.8% share of expected goals, 49.6% share of shot attempts, and 48.4% of goals at 5v5. Despite the Leafs and Bolts throwing blowouts at each other in games 1-4, games 5-7 showed just how close the two teams were. Trade deadline acquisition Nick Paul was a standout in the first round. One crazy stat for him – he drew 8 penalties in the 7 game series against Toronto. The real question mark will be whether Brayden Point will play for Tampa. At the time of publication, we do not have Point in Tampa’s roster, but his status is unclear. His absence would be a sizeable loss for the Bolts.
Carolina Hurricanes (1) vs. New York Rangers (2)
60.6% 39.4%
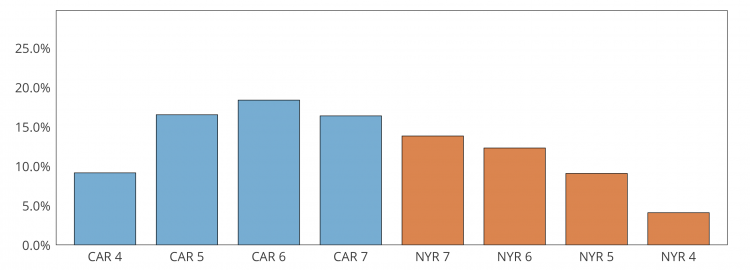
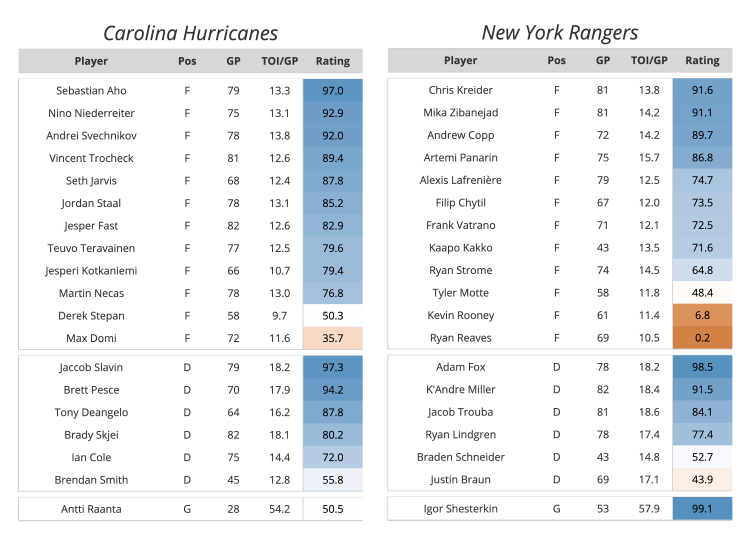
After a dominant start to their series against the Bruins, the Canes failed to win a single game in Boston. They had a negative shot and expected goal differential at 5v5, but a healthy 10.9% shooting percentage helped lead them to a commanding share of 5v5 goals. While they have one of the league’s best shorthanded units, the Canes shot themselves in the foot in their losses, spending too much time in the box. If Carolina can keep the game at even strength, their only barrier to winning is New York’s Vezina-winning goalie (we’re guessing here but certainty is high).
Let’s be clear – we don’t have a measure for heart. Supposedly there is no quit in New York, but Igor Shesterkin is back at it again. No one could have predicted this. The Rangers were heavily out-shot, out-chanced, and even out-scored at even strength in the first round. Still, the Rangers did what they’ve done all year – come from behind after Igor keeps them in the game. Some might take the anti-analytics angle, but this is really quite fun! While Carolina is the favorite, wouldn’t we all like to see how far this Rangers team could actually make it?
Western Conference
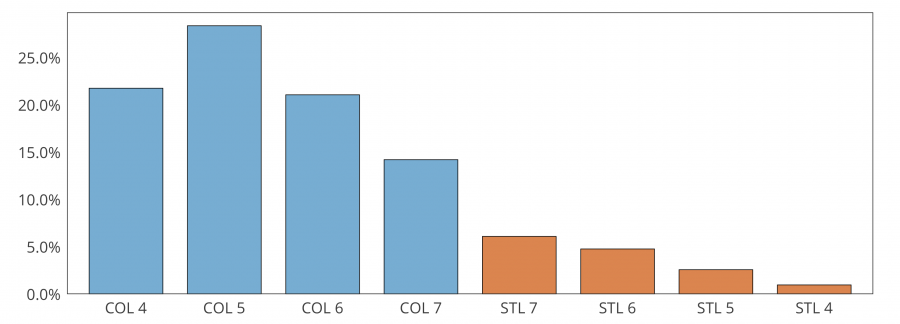
Colorado Avalanche (1) vs. St. Louis Blues (3)
85.5% 14.5%
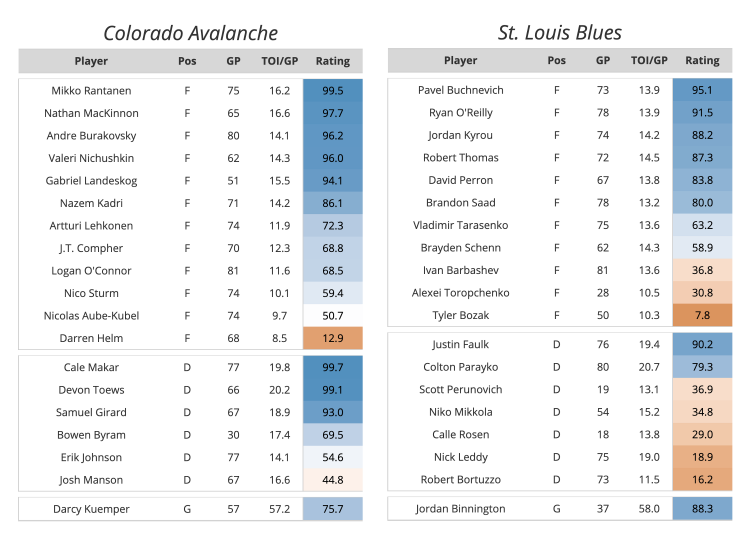
While we projected an 88.4% chance of the Avalanche beating the Predators in round 1, even we were surprised at how dominating they were in their win. Only the Penguins had a higher xGF% at even-strength, and the Avs led all playoff teams in their goals for percentage while registering only the 6th best shooting percentage. Their powerplay generated the most xGF/60 and CF/60 of any playoff team, they allowed the fewest xGA/60 and CA/60 shorthanded of any playoff team, and only the Flames/Stars series saw lower goals against numbers. Just like we thought, Colorado is scary. While the Predators were missing one of the best goaltenders in the league, it seems that regardless of who was in net, it would have been a sweep.
The Blues did the unthinkable. Well, for some people. Luke and I, on the other hand, are Minnesota sports fans and are all too familiar with incredible heartbreak and depressing results from our favorite teams. Regardless, the Blues showed up for their series as the (slight) underdog. While the Wild held a clear advantage in most shot metrics, the Blues played a very solid and safe game throughout, causing problems with their penalty kill. Ryan O’Reilly and David Perron were the only Blues players to maintain over 50% on-ice xGF/60 values, and it showed on the ice. One of the keys to the Blues victory ended up being Jordan Binnington, despite what we may have said in our round 1 coverage. In only 3 games he finished 4th in GSAx among all goalies in round 1.
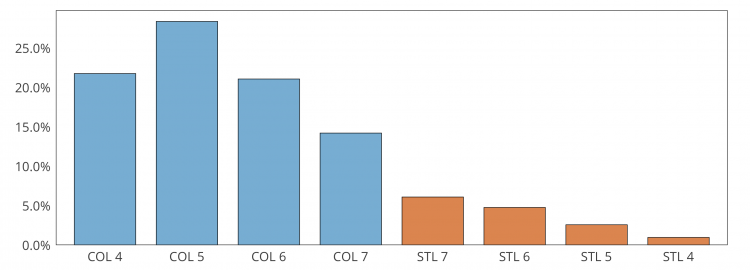
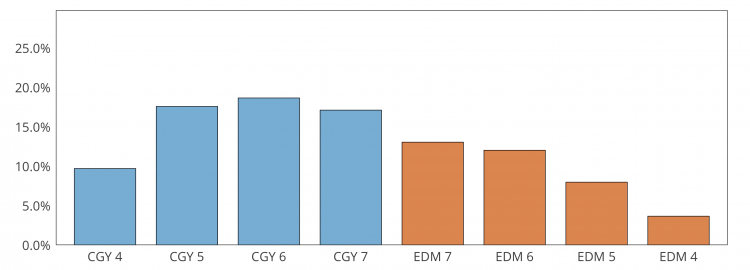
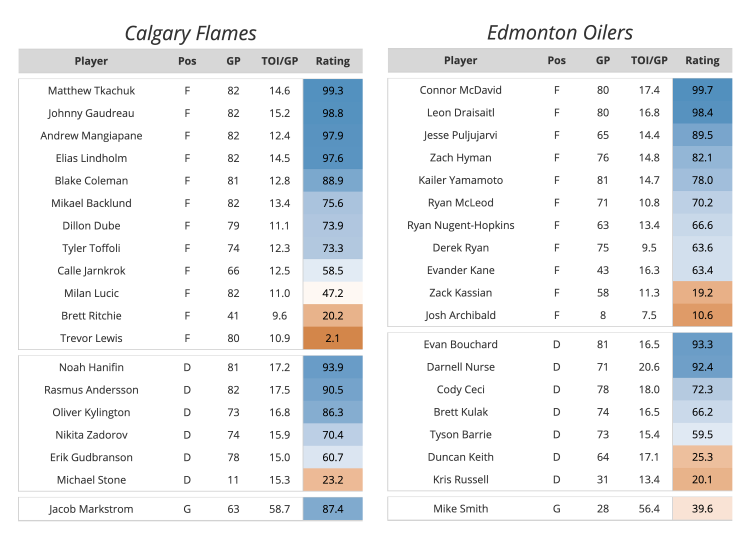
Calgary Flames (1) vs. Edmonton Oilers (2)
63.2% 36.8%
The Battle of Alberta. According to Wikipedia, the first hockey game between Calgary and Edmonton teams occurred in 1895. I tried to parse out something clever to say from the Wikipedia article here, but there’s too much there and I have work to do. As a silly American, I’ve been told it’s a big deal.
Anyway, Calgary. You did it. You beat the best playoff goaltending performance of the modern era. We had the highest first round projection for the Flames among any of the public models, so we were a bit relieved when they pulled off the win. Several of the games were extremely frustrating to watch regardless of our model-fandom. The Flames generated the 2nd lowest GF/60 at even strength (only higher than the Stars) with the 3rd highest CF/60 and xGF/60 among playoff teams in round 1. Game 7, however, was something to remember – Calgary attempted 134 shots (75 more than the Stars) and 5.6 expected goals (3 more than the Stars), but still barely won against one of the best goalies we’ve seen in the playoffs in years. It’s a little concerning they’re about to face… Mike Smith?
Edmonton, like Calgary, also required a 7th game to beat the scrappy Los Angeles Kings. To be quite honest, looking into the numbers, I’m not entirely sure how this series took 7 games. The Oilers put up one of the better all-around performances of any of the playoff teams. And they have McDavid – only the Crosby / Guentzel / Rust line for the Penguins generated more xGF/60 at even strength (that’s each player individually). The real story was Mike Smith’s consistent performance despite the uncertainty around him heading into the series. If you clicked on the link above, you may have noticed he was 9th on this list. He didn’t have a below-average game by GSAx, but never saved more than 2 goals above expected. The real test for the Oilers will be controlling the Flames’ ability to generate shots in every situation. While our model favors Calgary here, it’s hard to overstate just how impactful McDavid may be.