Note: this article was originally published on Hockey-Graphs 2019-01-15
Intro
Penalty differential figures are a rather ambiguous concept in hockey. It seems only recently that the majority of analysts and fans have stopped touting a player’s total penalty minutes as a positive aspect of a player’s game. Let’s get one thing clear: taking penalties is a bad thing and drawing penalties is a good thing. When a penalty is taken or drawn, the change in strength state (5v5 to 5v4 for instance) directly impacts the rate of goal scoring for a given player’s team (goals for and goals against). We can measure this change by determining league average scoring rates at each strength state and can then determine the net goals that are lost/gained from a penalty that was taken/drawn. This was first shown in the penalty component of the WAR model from WAR-On-Ice (WOI) here. A.C. Thomas explains it:
“A team on the powerplay scores at a clip of roughly 6.5 goals/60 and allows 0.78 shorthanded goals/60. We move each of those rates from a 5v5 rate of 2.5 goals per 60 minutes, and assume that 20 percent of powerplays end in goals, for an average of 1.8 minutes on the PP, and reach an average figure of 0.17 net goals per penalty taken or drawn.”
This allows us to convert a penalty taken or drawn into a goal value. This method was also used in Dawson Sprigings’ WAR model (no longer available) as well as Emmanuel Perry’s K Model and WAR model along with various statistical modeling techniques.
This has been the accepted method for converting a player’s raw penalties drawn or taken to a goal value; however, not all penalties are taken/drawn during a 5v5 strength state (and not all penalties are minors). Before proceeding, we will lay out our rules for how we define a “penalty” in the NHL as it pertains to this method:
- Offsetting penalties (strength state change of 5v5 → 4v4, etc.) are excluded as the net goal impact is equal to zero.
- Penalties that result in no strength state change are excluded (fighting majors, misconducts, etc.).
- Too many men and bench minors are excluded at the player level
- Superfluous penalties are excluded (misconducts, “stacked” unsportsmanlike conduct penalties, match penalties, etc.).
- Penalties that lead to a goal during a delayed penalty situation are not recorded by the NHL and therefore cannot be measured or included.
Using the above conditions, here is the breakdown of all penalties taken during each strength state from ‘07-08 – ‘16-17:
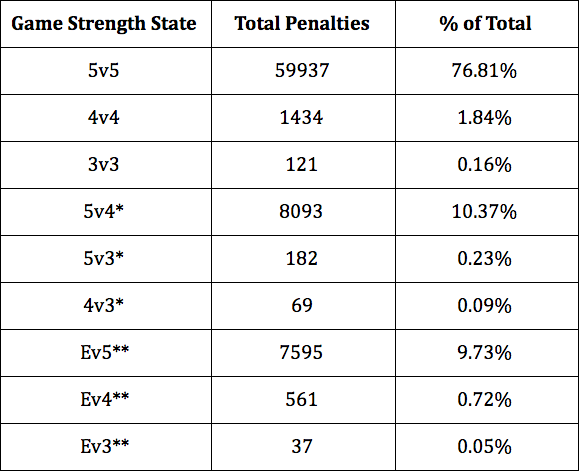
* All penalties taken or drawn during a powerplay or penalty kill.
** The NHL does not specifically record delayed penalty situations, which makes this type of penalty rather difficult to identify. If a team was able to pull their goalie after a penalty was called, the strength state when the penalty was recorded appears to be an empty net situation. We will address this later in the article.
Using a goal value of 0.17 for all penalties is fair given the fact that it covers the vast majority of penalties taken or drawn. However, 25% of all penalties taken impact team goal rates in a different way. What about a penalty taken when shorthanded? What about a penalty taken during 3v3 overtime? These penalties often feel much more impactful – especially if, for instance, a player takes a penalty 5 seconds into a 4v5 penalty kill. What follows is our attempt to expand the 5v5 → 5v4 penalty goal value calculation to include the net goals added from penalties taken or drawn at (almost) every strength state.
Note: This article was written between Dec 2017 and Jan 2019. Some of the data used spans ‘07-08 – ‘16-17 (10 years) and some data spans ‘07-08 – ‘17-18 (11 years). The years will be noted.
Scoring Rates
Similar to WOI’s method, we will use the following goal value calculation (shown as the net goal value of a 5v5 → 5v4 penalty):
- (((5v4 avg GF60 – 5v5 avg GF60) + (5v4 avg GA60 – 5v5 avg GA60)) * 120) / 3600
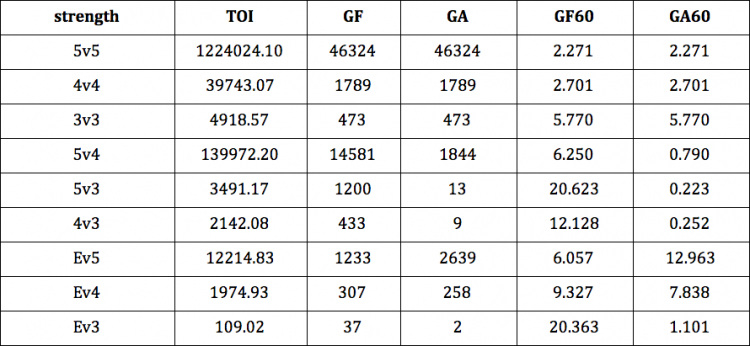
More simply, this is the goal value of average GF60 “gained” + average GA60 “prevented” over two minutes (or 120 second as shown above) of play moving from 5v5 to 5v4. To apply this to each strength state change, we first need to calculate the average GF60/GA60 at each strength state. Below, the league total goals for and against at each strength state are shown (’07-08 through ’17-18) and converted into rates (i.e. [GF / TOI] * 60):
League Scoring Rates:
We can now calculate the change in scoring rates for each strength state change caused by a penalty taken or drawn. The below tables show the change in GF60 and GA60 from the state a penalty was taken (row labels) to the state in which the powerplay took place (column labels). The next strength state is determined using the strength state that was recorded during the faceoff that occurred immediately after the penalty was recorded. A strength state change that is not possible has a value of 0.
Goals For per 60:
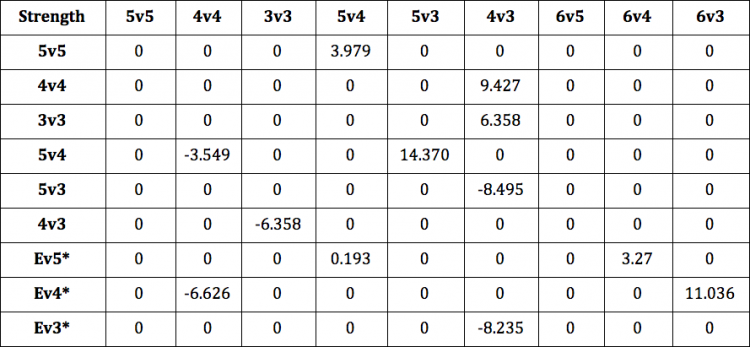
Goals Against per 60:
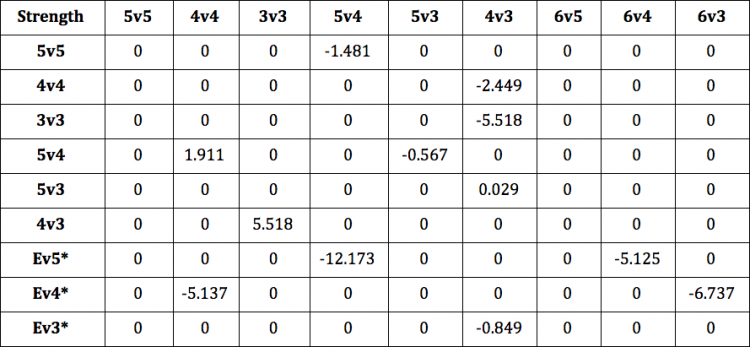
* Empty net goals against are rather problematic as we have not (as of now) been able to accurately separate empty net and delayed penalty situations. It is for this reason that we will treat a strength change of 6v5 → 5v4 as 5v5 → 5v4 (and so on). Ideally, a delayed penalty would be recorded as the strength state immediately before the goalie was pulled (5v5) moving to 5v4, and a true empty net situation (not the result of a penalty) would be measured as 6v5 moving to 6v4 for GF60 and 5v5 moving to 5v4 for GA60.
With these numbers, we can now complete the 5v5 → 5v4 GF60/GA60 change calculation that Thomas et al. originally developed (using 5 additional years of data):
5v5 minor penalty goal value = (((6.250 – 2.271) – (0.790 – 2.271)) * 120) / 3600 = 0.182 or
((3.979 – (-1.481)) * 120) / 3600 = 0.182
This value is assigned as a positive goal value to the player who drew the penalty and a negative goal value to the player who took the penalty. Rather than using the approximation of 1.8 minutes of powerplay time, we will be attribute the full 2 minutes for minor penalties (4 minutes and 5 minutes for double minors and non-fighting major penalties respectively). There is room for debate here. In our opinion, a player does not have control (or at least from a penalty-value standpoint) over whether that player’s team scores a goal (or allows a goal) in the ensuing powerplay/shorthanded situation. Initially we attempted to evaluate the length of ensuing states in a similar manner to WOI, but we found this to be not only a rabbit hole within the RTSS data but also unnecessary. A penalty is a penalty regardless of how a given player’s team performs after the penalty was taken/drawn.
The next step is to calculate the goal values of penalties taken during uneven strength states. For instance, what is the goal value of a minor penalty taken 30 seconds into a 5v4 shorthanded situation? For this, not only do we need to account for the immediate change in strength state (5v4 → 5v3), we also need to account for the additional 5v4 play that will result once the original minor expires. The calculation looks like this:
5v4 minor penalty goal value =
(((5v3 avg GF60 – 5v4 avg GF60) + (5v3 avg GA60 – 5v4 avg GA60)) * (120 – seconds since last penalty) / 3600 +
(((5v4 avg GF60 – 5v5 avg GF60) + (5v4 avg GA60 – 5v5 avg GA60)) * (seconds since last penalty)) / 3600
To explain further, the goal value of a minor penalty taken 30 seconds into a 5v4 shorthanded situation is 90 seconds of GF60/GA60 moving from 5v4 to 5v3 plus 30 seconds of GF60/GA60 moving from 5v5 to 5v4. The calculation looks like this (all values are taken from the three prior tables above):
((((20.623 – 6.250) – (0.223 – 0.790)) * 90) + (((6.250 – 2.271) – (0.790 – 2.271)) * 30)) / 3600 = 0.419 or
(((14.373 – (-0.567)) * 90) + ((3.979 – (-1.481)) * 30)) / 3600 = 0.419 or
(14.94 * 90 + 5.46 * 30) / 3600 = 0.419
Extras
Minor penalties cover the vast majority of all penalties. However, there are still penalty shots, double minors, and majors. For reference, here is the breakdown of penalty types from ‘07-08 – ‘16-17:
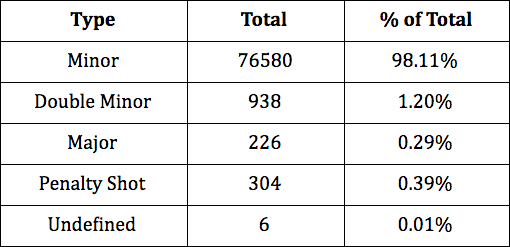
For double minors, the same calculation is applied, but the total penalty time that is used is 4 minutes (5 minutes is used for majors). All strength state changes still apply. For instance, on 12/15/16 Dallas’ Cody Eakin charged Henrik Lundqvist when the Rangers were 69 seconds into a 5v4 powerplay (video here). He received a 5 minute charging major. The goal value for this penalty would be calculated as follows: 69 seconds of 5v4 → 5v3 + 231 seconds of 5v5 → 5v4 resulting in a goal value of -0.546 that is credited to Eakin for taking this penalty. For players drawing major penalties, we calculate the value as if it were a minor penalty. This is mainly based on our view that the excessive goal value drawn in this situation is the result of the player who took the penalty doing something wrong and not the victim doing something right. In our opinion, the normal conditions for drawing a penalty are true, but the player drawing the penalty did not do anything additional to earn the extra 3 minutes of penalty time (additionally, referee discretion is involved). For double minors (of which almost all involve some sort of bleeding), we feel the ease with which one bleeds is a potential benefit in this situation. Thusly, we award the full 4 minutes of drawing a penalty to that player.
For penalty shots, we will use a different approach. Rather than use the same calculation that was described above, we will credit a player with league average shootout shooting percentage (as determined here) – or 31.94% (goal value of 0.3194). For the player who took a penalty that resulted in a penalty shot, we will assign the basic 0.182 goal value. This is an observational decision as we believe penalties that lead to a penalty shot are more often than not the result of a player interfering on a back-check – and, thus, more of a team breakdown than a normal penalty. No data is available to accurately measure this, but we will not further “penalize” players for taking a penalty that results in a penalty shot. This is a somewhat subjective decision, but it is a rare occurrence – only ~30 out of the ~8000 penalties taken each year are penalty shots. There is room to explore this further.
Assignments
Now that the basic method and exceptions have been laid out, we feel it is important to cover one of the areas of penalty taking/drawing that hasn’t really been explored – something we’ll call penalty “clusters”. When working with the NHL’s RTSS data, we discovered situations where an abnormal number of penalties were taken in the same (recorded) instance while the strength state only changed from, say, 5v5 to 5v4. The normal practice when recording penalties at the player level appears to involve assigning the respective take and draw regardless of the impact the penalty actually had on the change in strength state. If penalty differential is what is being used, it appears that this is not impactful; however, when measuring takes and draws separately we feel it is best to accurately represent the real impact on strength state a player caused (hence why offsetting penalties are excluded entirely).
Let’s demonstrate these penalty clusters. The following penalty sequence occurred during the Devils and Capitals game on 10/9/2010:
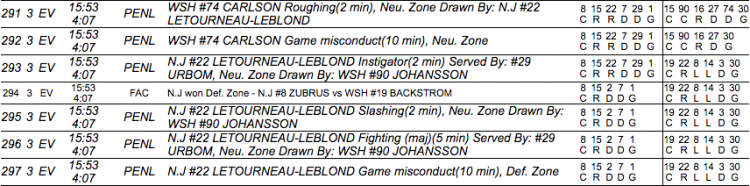
All of the above penalties were recorded at the same time, and the faceoff following the penalties was (for some reason) recorded in the middle of everything. So what happened here? The Capitals ended up with a powerplay (strength state change of 5v5 → 5v4). If we remove the superfluous penalties (game misconducts to Carlson and Letourneau-Leblond and fighting majors to Letourneau-Leblond and Johansson), we’re left with:
- Carlson minor for roughing drawn by Letourneau-Leblond
- Letourneau-Leblond minor for slashing drawn by Johansson
- Letourneau-Leblond minor for instigating drawn by Johansson.
Since the strength state changed as though one player took one penalty and one player drew one penalty, we initially attempted to “assign” the penalty based on who took the most penalties and who drew the most penalties in this instance. In each specific “cluster” we assigned -1 for a take, +1 for a draw, and calculated the sum. The player with the highest “differential” in the specific instance was awarded the draw and the player with the lowest differential awarded the take. This is what that looks like:
- Carlson take (-1) + Carlson draw (none) = -1
- Johansson take (none) + Johansson draw (+2) = 2
- Letourneau-Leblond take (-2) + Letourneau-Leblond draw (+1) = -1
However, as the above totals show, this method was less than ideal for assigning penalties in these situations (Carlson and L.L. sum to the same value which does not make assigning the take possible). Initially, it appears the strength state should change from 5v5 to 4v3 – Letourneau-Leblond and Carlson took offsetting penalties (5v5 → 4v4) and Johansson drew an additional minor (4v4 → 4v3). However, that is not what happened. Players were fighting and misconducts were handed out… Honestly, we’re not really sure what happened here (or why the ensuing strength state was only 5v4). This happens somewhat frequently with these scenarios. Given how difficult it is to untangle these situations, we will be excluding them from the totals.
There are instances, however, where two players take offsetting minors and one of the player takes an additional minor (putting the opposing team on the powerplay). This should behave like a 5v5 → 4v3 situation, but the offsetting minors act like fighting majors (no strength state impact). In these instances, only one take and one draw will be handed out (one take to the player who had two takes recorded and one draw to the player who had one draw recorded).
The NHL has somewhat strange traditions when it comes to recording penalties. We are not sure why multiple minors need to be awarded when the actual strength state impact is that of one minor penalty being taken and drawn. Additionally, it appears that the conventions may have changed since the 2007-2008 season which complicates things further. We’ve attempted to account for these scenarios to the best of our ability. As a rule, if a penalty “cluster” situation is unclear it is excluded from the final total as to not adversely impact a player’s totals due to a recording error.
Score & Venue Adjustment
The final step is to adjust for score and venue effects on penalties. As demonstrated by JLikens here, the score state and venue (home/away) have an effect on the frequency of penalties taken and drawn. Teams generally “sit” on a lead or “push” when behind, which leads to more penalties taken when leading and less penalties taken when trailing. Using 10 seasons of data, we can demonstrate the score and venue effects on penalties by totaling and sorting penalties in a similar fashion as Micah Blake McCurdy did for fenwick shots here:
If you are familiar with this score adjustment method, you will notice that penalties taken/drawn behave in a very similar fashion to fenwick shots – the home team takes fewer penalties when they are behind and the away team takes a lot more when they are ahead (and vice versa). However, because there is no clear pattern beyond a team simply trailing or leading, we will apply the adjustment to the three basic score states – home/away team when the home team is trailing, tied, or leading. We arrive at the following score and venue adjustments (‘07-08 – ‘16-17):
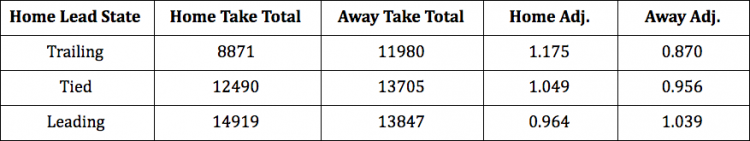
This adjustment is applied equally to the penalty goal value for a player who took the penalty and the player who drew the penalty. For example, the penalty goal value of a penalty taken by the home team when trailing is be multiplied by 1.175 – this is assigned as a positive value for the draw and negative value for the take. This adjustment is applied equally for every strength state. There is room to further explore score and venue adjustments for powerplay and shorthanded situations; however, as discussed earlier, we found this too difficult to parse at this time. This may be revisited in the future.
Additional Information
Now that the calculation has been laid out, we feel it may be beneficial to include the goal values for various penalties taken/drawn at each strength state:
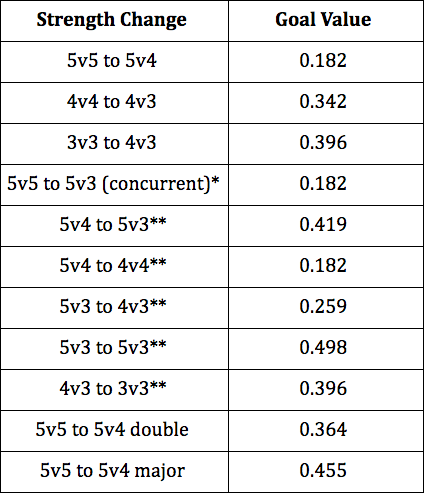
* simultaneous minors taken/drawn, .182 assigned for each. ** penalty taken 30 seconds into the previous special teams situation.
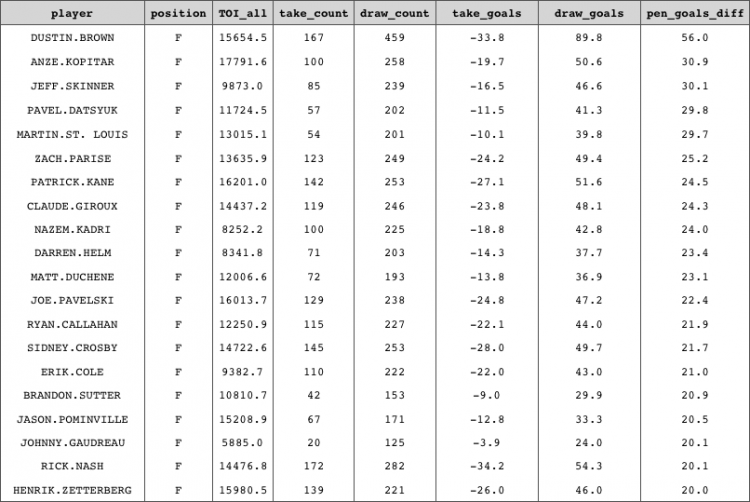
Let’s look at the “leaders” over the past 11 seasons.
Top 30 Forwards and Defensemen in “Career” Penalty Goal Differential (raw, ‘07-08 – ‘17-18):
Bottom 30 Forwards and Defensemen in “Career” Penalty Goal Differential (raw, ‘07-08 – ‘17-18):
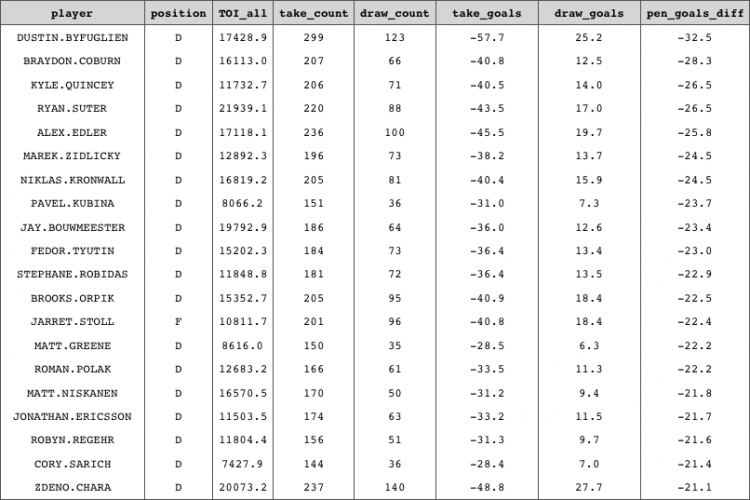
Above Average
As you can see in the above charts, defensemen draw far fewer penalties than forwards (and take slightly more). There are many reasons for this, but comparing forwards and defensemen is rather difficult. For this reason, we feel it is best to look at these numbers from an “above average” standpoint per position. The method for converting the penalty goal values to above average is borrowed from baseball’s method for calculating Weighted Runs Above Average here (among other metrics). Each player’s penalty goals taken/drawn per minute is centered around the per minute league average for the specific position and multiplied by the respective player’s total time on ice:
Penalties Goals Taken Above Average = ((Player Penalty Goals Taken / Player TOI) – Position Penalty Goals Taken per Minute) * Player TOI
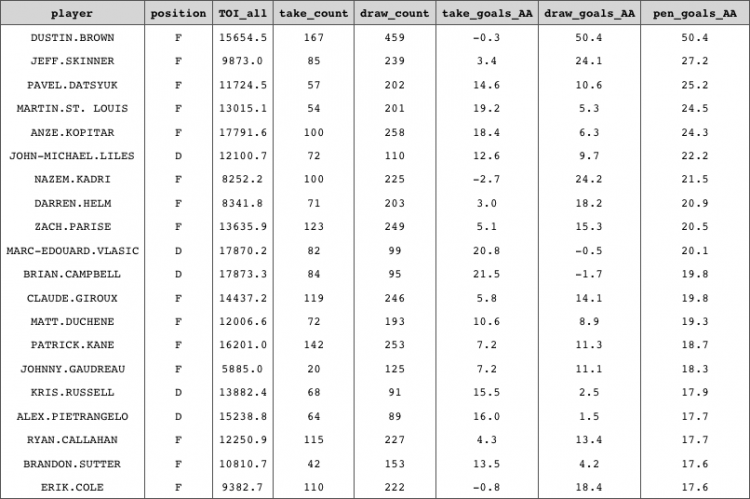
This results in a number that is relative to the positional average per season where average is zero (for both taken and drawn). Using this method, here are the new top 30 forwards and defensemen over the past 11 seasons (using per-season averages):
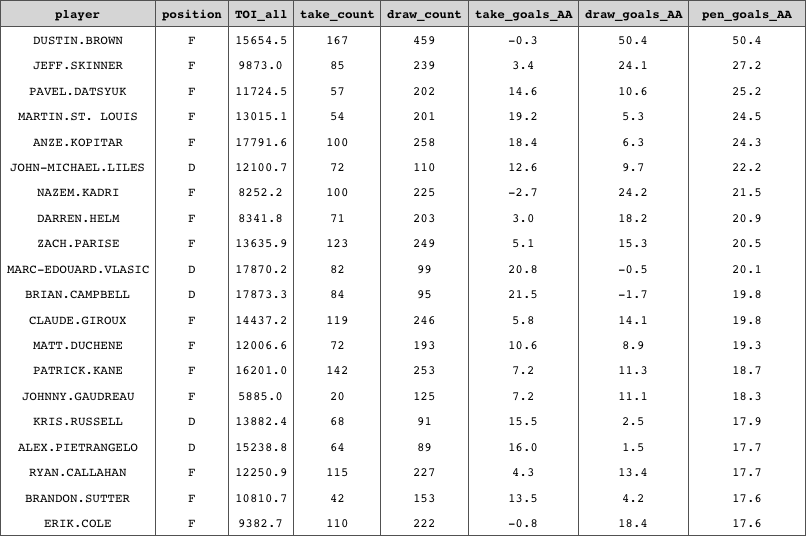
Top 30 Forwards and Defensemen in “Career” Penalty Goals Above Average (‘07-08 – ‘17-18):
Bottom 30 Forwards and Defensemen in “Career” Penalty Goals Above Average (‘07-08 – ‘17-18):
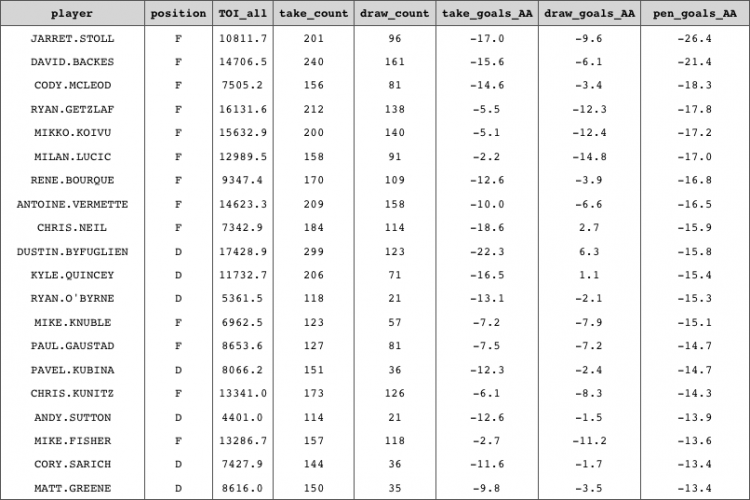
Our hope was to complete this process for each strength state; however, TOI is also difficult to determine for the specific instances when the penalties were taken (due to the issues with delayed penalty situations). This is something we hope to account for in the future.
Conclusion
Overall, we feel this penalty goals process is a much more accurate estimation of the “real” goals added from penalties for each player in the NHL. Additionally, centering each player’s rate of penalties taken/drawn around the positional mean allows for a much more interpretable final number. As we have noted multiple times, there is additional work that can be done. Others have explored various modeling techniques to measure a player’s value added from taking or drawing penalties (links throughout). These techniques could provide benefits in multiple ways, and we may explore this in the future. We feel the method we’ve covered here is a solid foundation for more accurately describing the value a player can add or subtract by drawing or taking penalties. All data can found be found on https://evolving-hockey.com, and all of our code (R) for this method can be found on GitHub here.
Acknowledgements:
- Emmanuel Perry for his DryScrape NHL scraper – the NHL’s RTSS data was retrieved using the code available on his GitHub.
- A.C. Thomas, Emmanuel Perry, Dawson Sprigings, and JLikens for their previous work with NHL penalty data that was foundational in developing this method.
Where is the calculation of the value of laying a good crosscheck on someone’s hands making them think twice about celebrating next time they score a fancy goal?
One time in 1993 I saw Jim Matheson eat a bagel whole. One bite just like that. You can’t put a number on experience like that.
when are the twins going to measure jim matheson’s value to the community? that’s what I want to know.
Jimmy and I once went to a thrift store in Quebec and bought a set of soup spoons. Swell guy!
Is it possible to determine between delayed penalty vs. empty net by looking at score and time left, just counting 6v5 while trailing with <5 minutes as EN and all other 6v5 situations as empty net? Not exactly precise, but might be better than excluding them altogether.