The season is somehow already here? I feel like I just finished our playoff previews. Can’t we just have another month to bask in the glory of a cup for Nichushkin? As a former Wild fan, that just sounds horrible to say (6-year-younger me would be quite confused). In all honesty, I’m ready for hockey to start again. This season is shaping up to be very interesting for numerous reasons. We’ve been working around the clock to finalize our team projections, and as always, we have some interesting results.
You’ve clearly already seen the projections since not including a featured image in the post makes the front-page card look a little weird, but before we get into that too much, I’ll provide a little info about how the projections work and how we arrived at the results. Up front, the model hasn’t changed much since last year – that’s not to say we (well, Luke specifically) didn’t try. Sometimes a model ends up just kind of working well and any attempt to “improve” said model proves difficult. Since it’s been a couple years since we covered how the model works, I think it’s time we do that again.
The current projections can be found here!
Model Info
This is an updated version of our explainer from the previous description here.
Our playoff probabilities are generated in a three-step process. We use a model to project “future” value for all players, use these player projections to build a game probability model that projects the winning % of any given team matchup using logistic regression, and then feed these individual game probabilities into a Monte Carlo simulation that generates the outcomes for all games in a season. To complete this process, each team’s player projections are aggregated into Forward, Defensemen, and Goalie groups, and various metrics are used for each group which are then fed into the game probability model. With these inputs, we can generate home and away team winning percentage values. Once we have all home/away probabilities projected for each game in the season, we prepare the simulation.
For each game in the simulation, we only care about the projected winning % for the home team. Take a game between a home team and an away team. The process laid out above gives us a winning % for each team. We replace the away team’s projected probability with a random % between 0 and 1. If the home team’s projected winning % is higher than the random number, they “win” the game (they “lose” if it is lower). This is done for each game in the season and then repeated tens of thousands of times. Once the simulation is complete, we check how many times each team won a game, sum the total games won, and arrive at each team’s projected point total.
The first step is generating multiple player-level models, which produce ratings for all players in the league. For skaters, we found our xSPAR metric (Expected Standing Points Above Replacement) as well as a custom “game score” model (built using Box Score metrics) works best for predicting future team game outcomes. Our SPAR and RAPM metrics were also tested but they did not perform quite as well for this specific task. The “game score” model we are using is similar to Dom Luszczyszyn’s Game Score model; however, we tested various box score metrics and weighted them through a “grid search” approach to optimize predicting future team game win probability. For the simulation, we set the schedule for all teams, add in the projected game probabilities, and then run the simulation.
We still use a roster-level system, project various metrics for every player for next season (notably xSPAR and our own “game score” metric), determine the roster for every team (based on CapFriendly’s depth charts and research for injured players), aggregate those individual projections into team ratings for forwards / defensemen / goalies, and compute game probabilities for every game in the ’22-23 schedule. We then run a Monte Carlo simulation 50,000 times with all of that in place to project point totals for all teams in the league. As the season progresses, this simulation is re-run with updated data.
The Projections

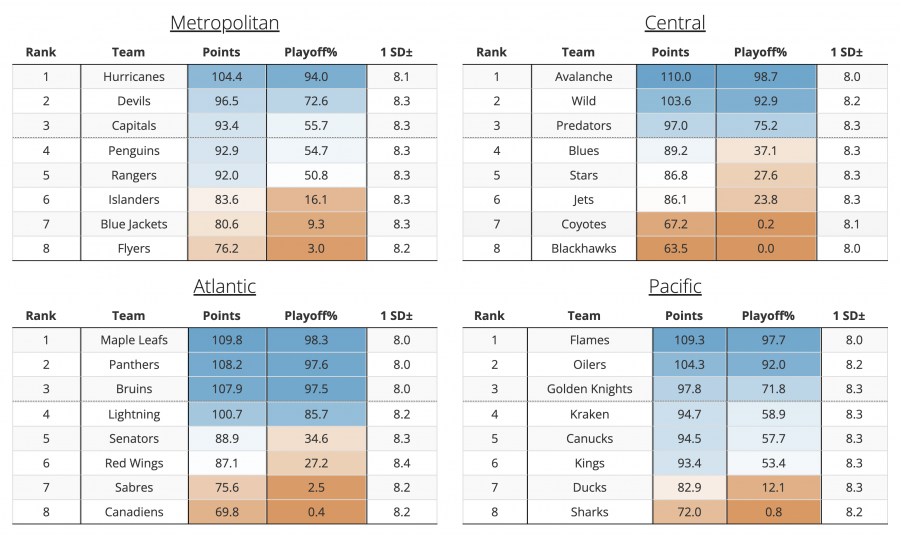
A couple things up front: we display the standard deviation derived from the simulation we run, which can be interpreted as the range we expect a given team to fall +/- their mean point value. Technically speaking, this is the range created by the simulation. It can be hard to completely capture uncertainty of every facet in the league, so the variance here and range of outcomes should likely be a bit wider. But for this purpose, it’s a good number to gauge where we expect a given team to fall.
Looking at the median points in the divisions first, we can get an idea of overall strength:
- Metro: 92.5
- Atlantic: 95.2
- Central: 88.4
- Pacific: 95
Compared to last year, we see the biggest change overall in the Pacific, which now challenges the Atlantic as arguably the best division in the league with the ascension of Calgary and Edmonton into the top-10. As I’ll cover a bit below, however, parity in the league (save a few exceptions) seems to be “returning” in a sense, so the divisions are closer than they were heading into last season.
Let’s run through each division by comparing our current projections for the ’22-23 season with our projections heading into last season. Each division is sorted from largest positive to largest negative change – the “blue” teams here improved the most while the “orange” teams did the opposite.
Atlantic
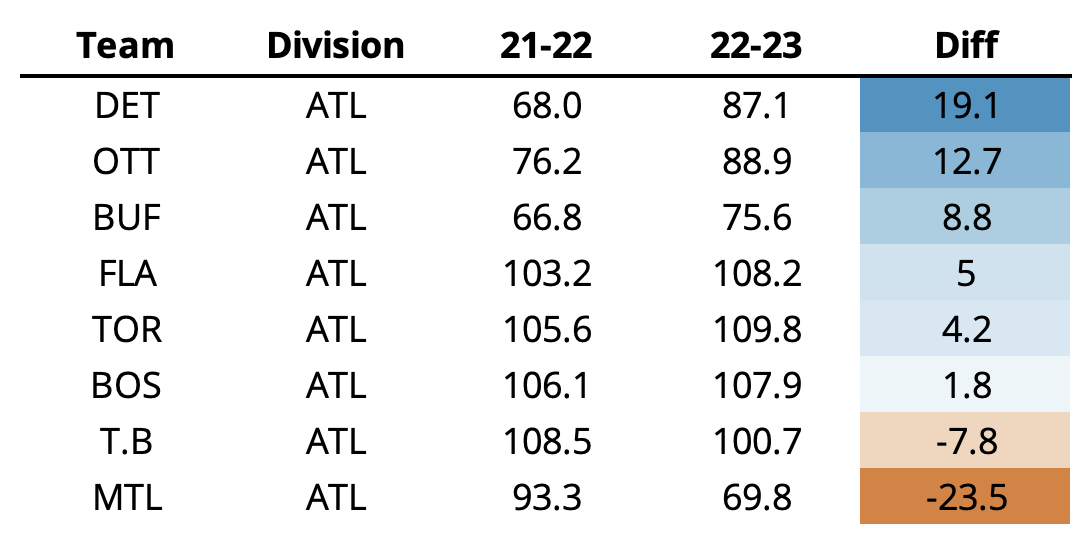
Surprisingly, the Atlantic has the most teams who increased in our projections year-over-year. While the “good” teams (Toronto, Florida, Boston, Tampa Bay) still project to be, unsurprisingly good, Detroit, Ottawa, and Buffalo improved the most. For the Red Wings, the additions of Copp, Perron, and Kubalik along with rookie breakout seasons from Raymond and Seider add a whopping 19 points to our projections this year. Ottawa’s increase may be a little more obvious; the marquee additions of Claude Giroux and Alex Debrincat are well-known, but Tyler Motte and Mathieu Joseph are nice upgrades from last season.
Montreal has, on the other hand, completely tanked (at least based on our projections). They still have Caufield and Suzuki at the top of their lineup, the offseason addition of Evgeny Dadonov is a great pickup, and Mike Matheson strengthens their defensemen group. However, Montreal may just have the worst defensemen group in the league. For Buffalo, we really were hoping they’d come out a bit higher, but I think they might be another year or two away from real improvement – unless Owen Power wins the Norris and Rasmus Asplund wins the Selke. Both of which could happen!
Metropolitan
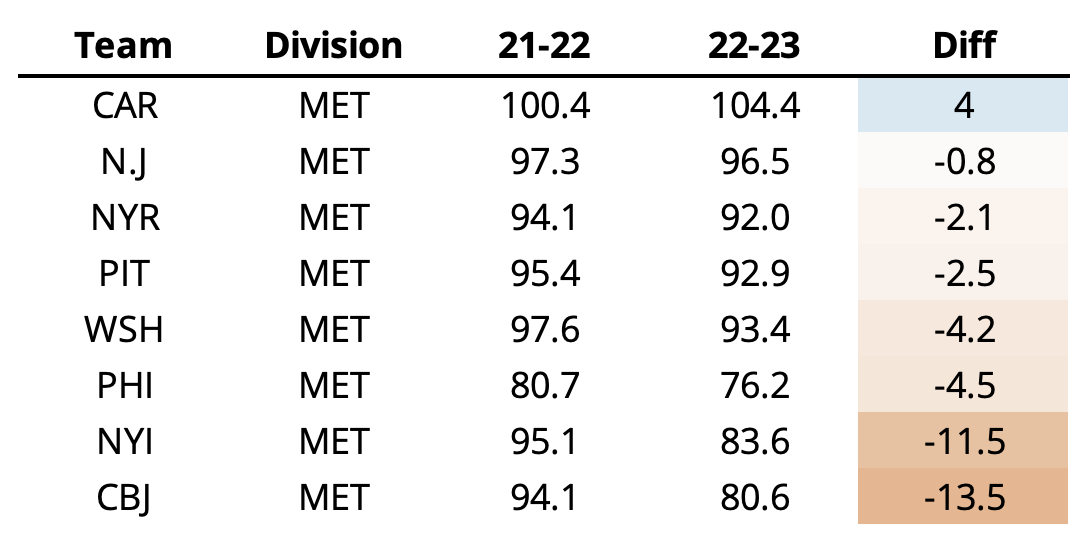
The Metro changed the least. Not only is the overall spread in differences small compared to the other divisions, but our rankings this year are in the exact same order as they were last year. Basically, we’re still going to get sh*t from the New York fans and be best friends with New Jersey fans. Carolina is the only team that improved based on our model (it’s only 4 points). Some of this has to do with their offseason: Ethan Bear and Paul Stastny are nice additions along with Seth Jarvis’ huge improvement, but really they’re essentially the same team they were last season.
You could almost make this argument for the Devils – their projection among all teams is the closest to what was last season. A healthy Dougie Hamilton helps that quite a bit, but they also have the continued improvement of Jack Hughes and Jesper Bratt along with a great signing in Ondrej Palat. Other than Seattle, no team got goalied as hard as the Devils, and while Blackwood is a big question mark, the addition of Vitek Vanecek adds some potential stability. Vanecek is on my fantasy team so I hope so.
Central
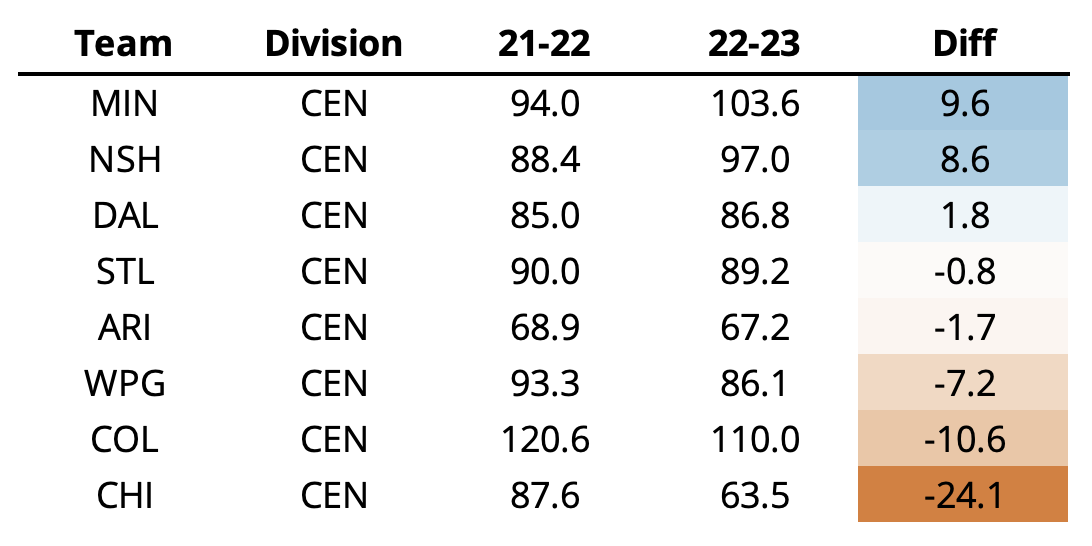
As noted above, the Central dropped in strength, but Chicago’s extreme potentially Bedard-motivated offseason is doing wonders for the aggregate evaluation. It’s almost a thing of beauty how bad Chicago has gotten seemingly overnight. Using Capfriendly’s projected depth chart, Colin Blackwell ranks as their best skater in projected xSPAR. They’re set up to be truly terrible this season. Colorado, at the complete other end of the spectrum, is still projected to be the best team in the league despite dropping almost 11 points in our projections. Almost all of this is due to their free agency losses – Nazem Kadri, Andre Burakovsky, and Darcy Kuemper leaving the team “hurts” them quite a bit, but who are we kidding, they’re the defending cup champions.
Minnesota baby, right? With the continued improvement of Kirill Kaprizov, the out-of-nowhere surge in Ryan Hartman’s production, and young talents in Matt Boldy and Marco Rossi, the Wild are still projected to be an easy lock for the playoffs. And while their defensemen group isn’t what is used to be, Jared Spurgeon has so far shown no signs of aging, and Calen Addison is nice upgrade over Jordie Benn. Poor Arizona.
Pacific
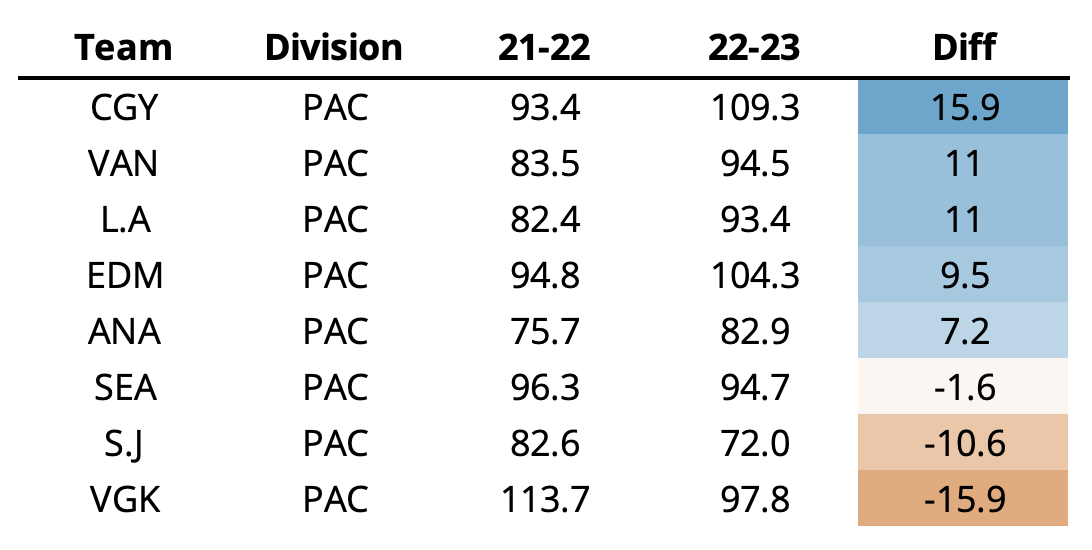
Unlike last year (where we missed on this entire division it seemed), this year is our year for the Pacific (maybe). Despite Calgary’s tumultuous offseason, the additions of Huberdeau, Kadri, and Weegar make up for the loss of Johnny Gaudreau and Matthew Tkachuk. Vancouver and Los Angeles here are interesting mostly for their gains while not having particularly interesting offseasons. The Kings’ addition of Kevin Fiala was a big add, but each teams’ existing players improved as well, which is driving this increase more than anything.
Seattle’s projection, on the other hand, is basically the same as what we had last year. While the team vastly underperformed expectations in ’21-22 (at least based on several of the public models including this one), the additions of Oliver Bjorkstrand and Andre Burakovsky, along with the model’s somewhat bullish view of their goaltending after a surely unsustainably bad stretch last year, we are once again projecting a possible playoff appearance from the Kraken. And with the strength of Buoy? Shoo-in.
Wrapping Up
If the changes in our projections this year from last are any indication, it appears league parity is increasing? To be honest I’m still not entirely sure how to use “parity” in a sentence. Several of the divisions have tightened compared to last year, several of the strongest teams have dropped (Colorado, Tampa Bay, Vegas), and a few bottom-feeders have made big improvements (Ottawa, Detroit, Buffalo). But next summer’s draft looms large for a select group of especially poor teams. Right now, in our opinion, Chicago is the front-runner in the race for Connor Bedard, but Arizona and Montreal seem to be motivated and ready.
We’re at a very interesting point in the NHL’s changing environment. After the incredible impact the COVID-19 pandemic had on the previous three seasons, rumors of a rising salary cap and potential tank-a-athon introduce storylines we haven’t seen in a while. While some may be hoping the Leafs lose in the first round again or Minnesota wins the Cup, others may just be cheering for their team to lose. At home. Can Chicago top the ’14-15 Buffalo Sabres? The answer is, of course, no, but I’d be lying if I said I wasn’t looking forward to seeing if they try.