It’s official: the NHL season is back. Only five days remain in the NHL preseason, and the regular season begins in one week (October 12, 2021). We’re at the point where rosters for teams are starting to come together. Most players who held out during free agency have signed contracts (or likely won’t be signed before the start of the season), more information is available about the status of injured/missing players, and final cuts are being made during training camp. With all of this in place, we’re ready to release our final point projections for all teams heading into the ’21-22 season.
If you’ve been following along, we did release our initial projections a little over a week ago. As of publication, our updated and final preseason point projections for all teams can be found here. The model we use is essentially the same one that we used for our playoff projections last spring. We covered this in detail in our round 1 playoff article.
We’ve made a few updates to the model / system since the 2021 playoffs, but for the most part, not much has changed. We still use a roster-level system, project various metrics for every player for next season (notably xSPAR and our own “game score” metric), determine the roster for every team (based on CapFriendly’s depth charts and research for when injured players might come back), aggregate those individual projections into team ratings for forwards / defensemen / goalies, and compute game probabilities for every game for the ’21-22 schedule. We then run a Monte Carlo simulation 50,000 times with all of that in place to project point totals for all teams in the league.
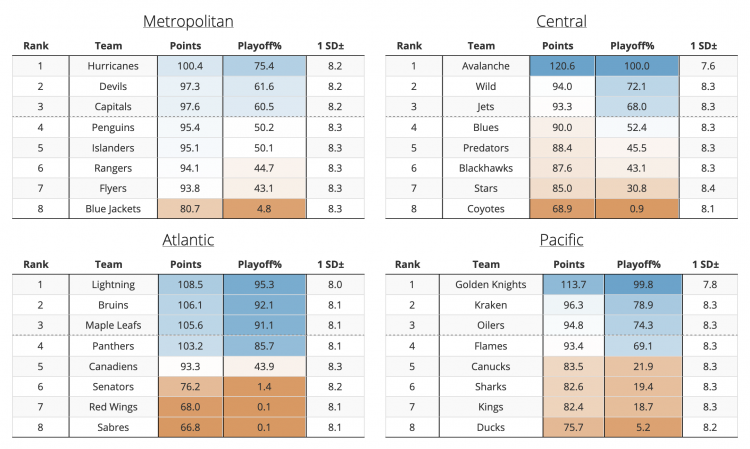
Without further ado, here are our ’21-22 season point projections for all NHL teams:

A few points of clarification. The simulation gives us both mean and median points for all teams. In the past, we’ve used median points here, but we’ve decided to switch to mean points. The only noticeable change is that decimal points have been introduced in the projected point totals for all teams. To be honest, it doesn’t really matter if median or mean is used here – the difference is mostly a philosophical one in our opinion. Additionally, it can be confusing when comparing the projected point totals and playoff probabilities – in our initial projections, several teams within divisions were tied in their projected points, but their respective playoff probabilities were different (as you can see, there is still an interesting discrepancy here between two teams – more on that below).
Observations
For the ’21-22 season, there is a non-marginal disparity between the Eastern and Western conferences. Here is the median of each divisions’ projected point totals:
- Atlantic: 98.3
- Metropolitan: 95.2
- Central: 89.2
- Pacific: 88.4
Among the divisions, the Atlantic is by far the best, followed by the Metropolitan – both eastern conference teams. While almost a point separates them, both the Central and the Pacific are quite bad save for each containing the top two teams in the league per our projections. The next best four teams after Colorado and Las Vegas are all in the Atlantic division (Tampa Bay, Boston, Toronto, and Florida) and are all separated by a little over five points. While these teams are all very good, they also get to beat up on three of the five worst teams in the league (Ottawa, Detroit, and Buffalo), which pads their total points overall. Montreal is stuck in the middle here, possibly on the outside looking in with their 43.9% probability of making the playoffs.
The Metropolitan division may contain the most parity in the league this season. Only Columbus is projected in the bottom half of the league (80.7 points, 27th overall). Carolina, Washington, and New Jersey are all within 3 points of one another, and Pittsburgh, both New York teams, and Philadelphia are within 7 points of first place in our projections. New Jersey and Washington are interesting cases here – while the Capitals have a 0.3 point higher projection than the Devils, the Devils have a 1.1% higher chance of making the playoffs. We re-ran our simulation several times in an attempt to see if this was an oddity, but we found this same result happened every time. My guess here is that 0.3 points is basically tied, and the Devils have the slightly more-favorable schedule. These teams should be considered basically the same.
Almost 27 points separate Colorado from the next best team in the Central – Minnesota. This is just ridiculous. Six of the Central’s eight teams are within 9 points of one another, and while this may not be the “best” hockey in the NHL, this division is easily the most up-in-the-air heading into the season. Save Arizona and Colorado, this division really feels like it’s going to be a classic race to not make the playoffs down the stretch.
And then there’s the Pacific. As mentioned, not only is Vegas one of the best teams in our projections, but they also get to play against some very questionable squads (Vancouver, San Jose, Los Angeles, and Anaheim). I’ll admit, there are some “unknowns” in this division – L.A. has a young group of players that they may or may not play, and rookies are quite hard to project within an 82-game season. Then there’s Seattle. A new expansion team has entered the chat, and right now, they’re in a playoff position sitting 2nd in the Pacific. While most players on the Kraken have previous NHL time, playing for an entirely new team in the league adds a level of uncertainty that we, frankly, can’t gauge.
Closing
We’ll be updating these point projections and playoff probabilities daily once the season begins. We should have a few more charts and visualizations to go along with these once we get into the season. Also, keep an eye out for our new daily-updating game projections on the site. We’ll have more information later this week. Please let us know if you have any questions or see anything that appears incorrect. Let the games begin!

Thanks for the post, y’all!
I’m curious, what’s the relationship between xSPAR and EH Game Score? Is one weighed more heavily than the other? Do you have a conversion chart/formula?
For the Flyers, you’ve got them pacing for more points than Dom’s model, but they do have two of the most valuable skaters by your xGAR projections. Is the rest of the roster just that weak?
It’s kind of hard to say for sure, but we estimate the weighting for xSPAR/Game Score is 60/40 or possibly a little higher for xSPAR. It’s also not the same for forwards and defensemen (another reason why it can be hard to estimate). But overall, xSPAR receives a slightly higher weight than our game score metric.
Regarding the Flyers, I’d say that’s more or less right. The Flyers have Couturier and Giroux, but the flip side is quite lacking (Thompson, Brassard, Ristolainen, Yandle, etc.). However, they’re still well within the range of projections that they could end up in a playoff spot – 4 points behind WSH/N.J. in the Metro. The Metro is very close overall.
Thanks for the explanation!
I did notice that the Metro was close (it pretty much always is), just brutal that the Flyers have failed to surround Giroux with adequate help for his entire career. It is fascinating that your projected division winner only has a 75% chance to make the playoffs.
67 points for Buffalo seems really high. They do get to play the Wings and Sens a lot, so catching the 75 Caps is unlikely, but I find it hard to imagine they can win anywhere close to 20 games.
I would say that there are “lower” bounds within a projection / simulation system like this given the amount of uncertainty in hockey game outcomes. I’ll have to check, but I want to say that Buffalo this season is the lowest we’ve had in the last few seasons. Detroit last year was a point higher (prorated for a full 82 game season). And like you said, they do get to play against DET and OTT this year too.
Kraken at 79% to make the playoffs is a shocker to me. I get that the Pacific is bad, but that number seems awfully high.
Dom Luszczyszyn has them at 77%. HockeyViz has them at 56%, which is still third in the Pacific (Michah’s probabilities overall are flatter, with top teams lower and bottom teams higher than EH and Dom). MoneyPuck has them at 64% (again, third in the Pacific – also has flatter probabilities).