
Last year, we published “An (Early) Review” article on the site about a week after free agency began. At the time, it felt appropriate given all the events that occurred around free agency with the addition of the Seattle Kraken to the league. This year, I thought it would be more appropriate to wait a little longer to do our review. Turns out a month feels right? In reality, our model actually has contract signing periods built into it, and the “first” period ended yesterday, so this is the perfect time for a review. Like last year, I’ll be covering how our contract projection model has performed this offseason and, in turn, how it’s evaluated NHL teams and players from a contract vs. expected performance standpoint so far.
Model Evaluation and Environment Discussion
Before we get too far, let’s dig into some model evaluation. For those who are unfamiliar, we here at Evolving Hockey offer contract projections for NHL players every offseason. This model/tool is our prediction of the contracts current free agents (along with non-free agents) are most likely to receive for their next deal. If you’re unfamiliar with the model, please reference the following for more information about what it is and how it works:
- Original article about the model
- Glossary
- Summary in our review from last year
Here is some general information about the projections in 2022:
- All data is provided by CapFriendly. None of this would be possible without CapFriendly. They are the absolute best.
- We projected contracts for 474 free agents: 280 forwards, 137 defensemen, and 57 goalies.
- Among these players, 318 were UFAs and 156 were RFAs.
- At the time of publication, 232 of the original 474 players have signed contracts (146 are unsigned). Only 9 of the remaining players have a projected cap hit over $3M per year. Nazem Kadri remains the lone free agent projected over $4M per year.
For model evaluation, we look at two things when comparing our projections to the actual contracts: R2 and Mean Absolute Error (MAE). Because the model is actually a system of two models (cap hit and term/length), we evaluate both, but only MAE is relevant for the term model. The term model is interesting as we only really have one metric to evaluate it, so I’ll just share it now. For all free agents, our MAE was 0.9. This means that on average, we were off by a little under 1 year +/- for all players. This is mostly in line with recent years. There aren’t many interesting things we can talk about here, so I’ll just leave it there.
First, let’s look at the overall comparison of projected vs. actual contracts:
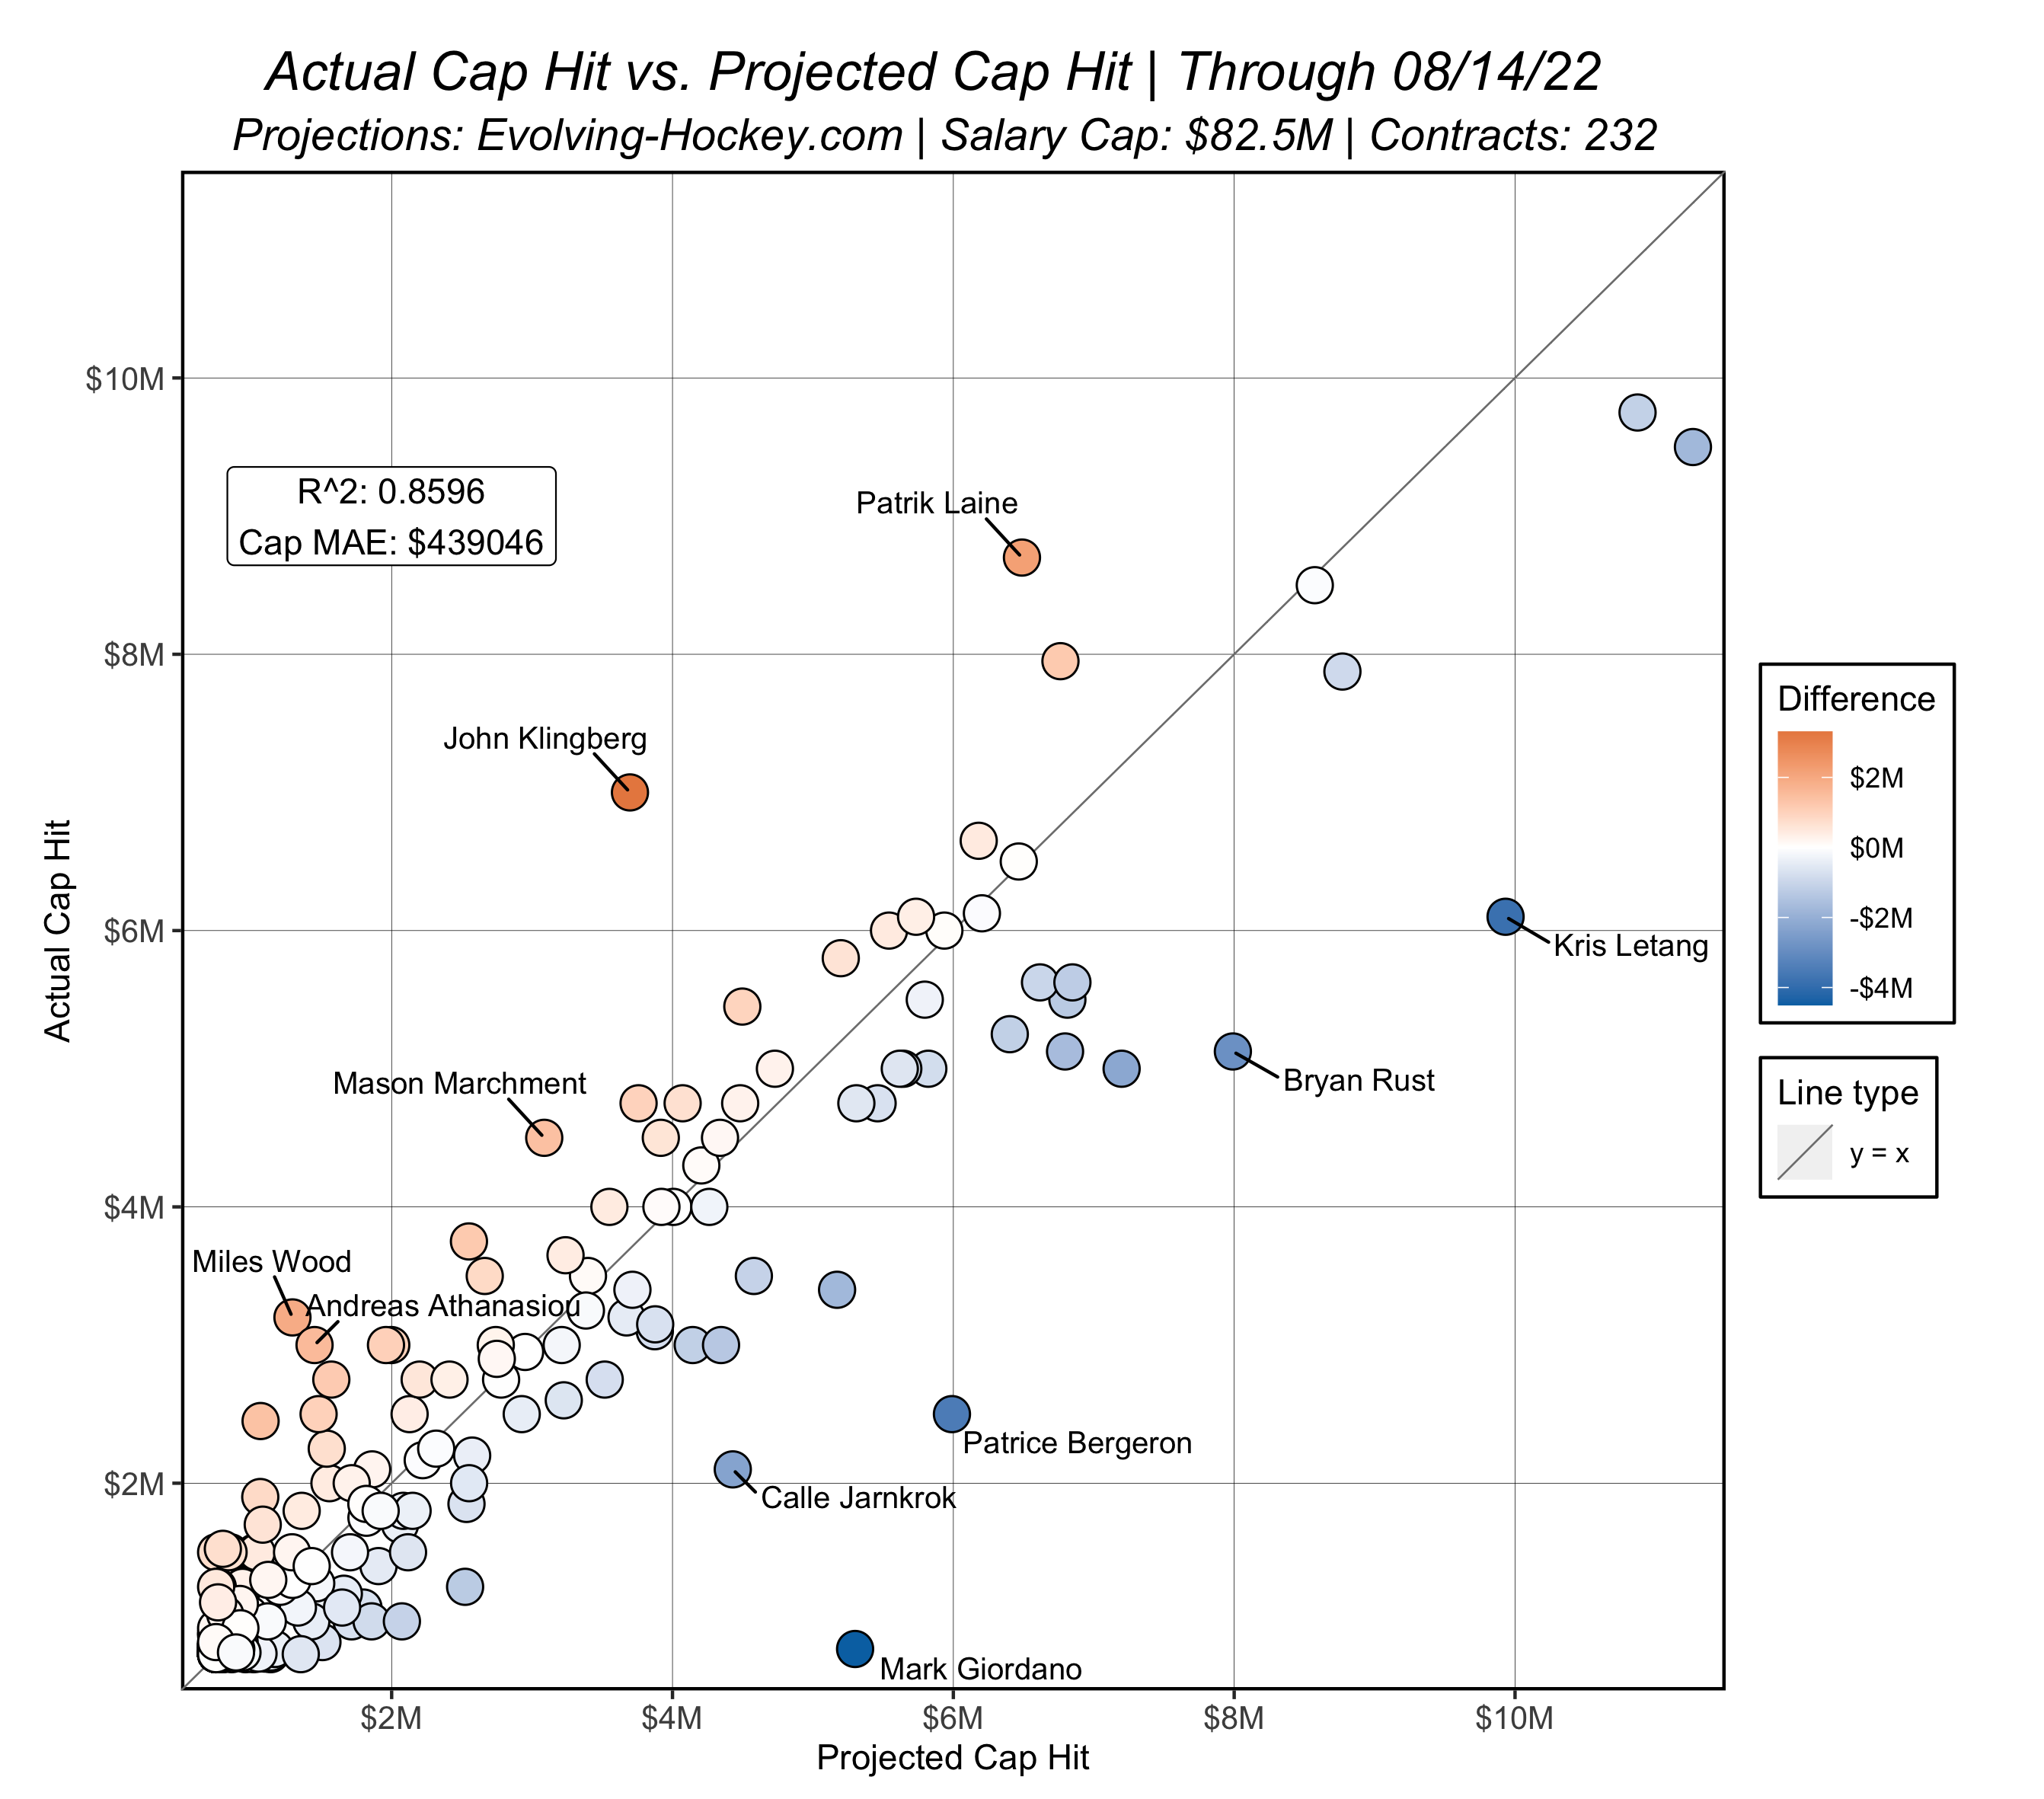
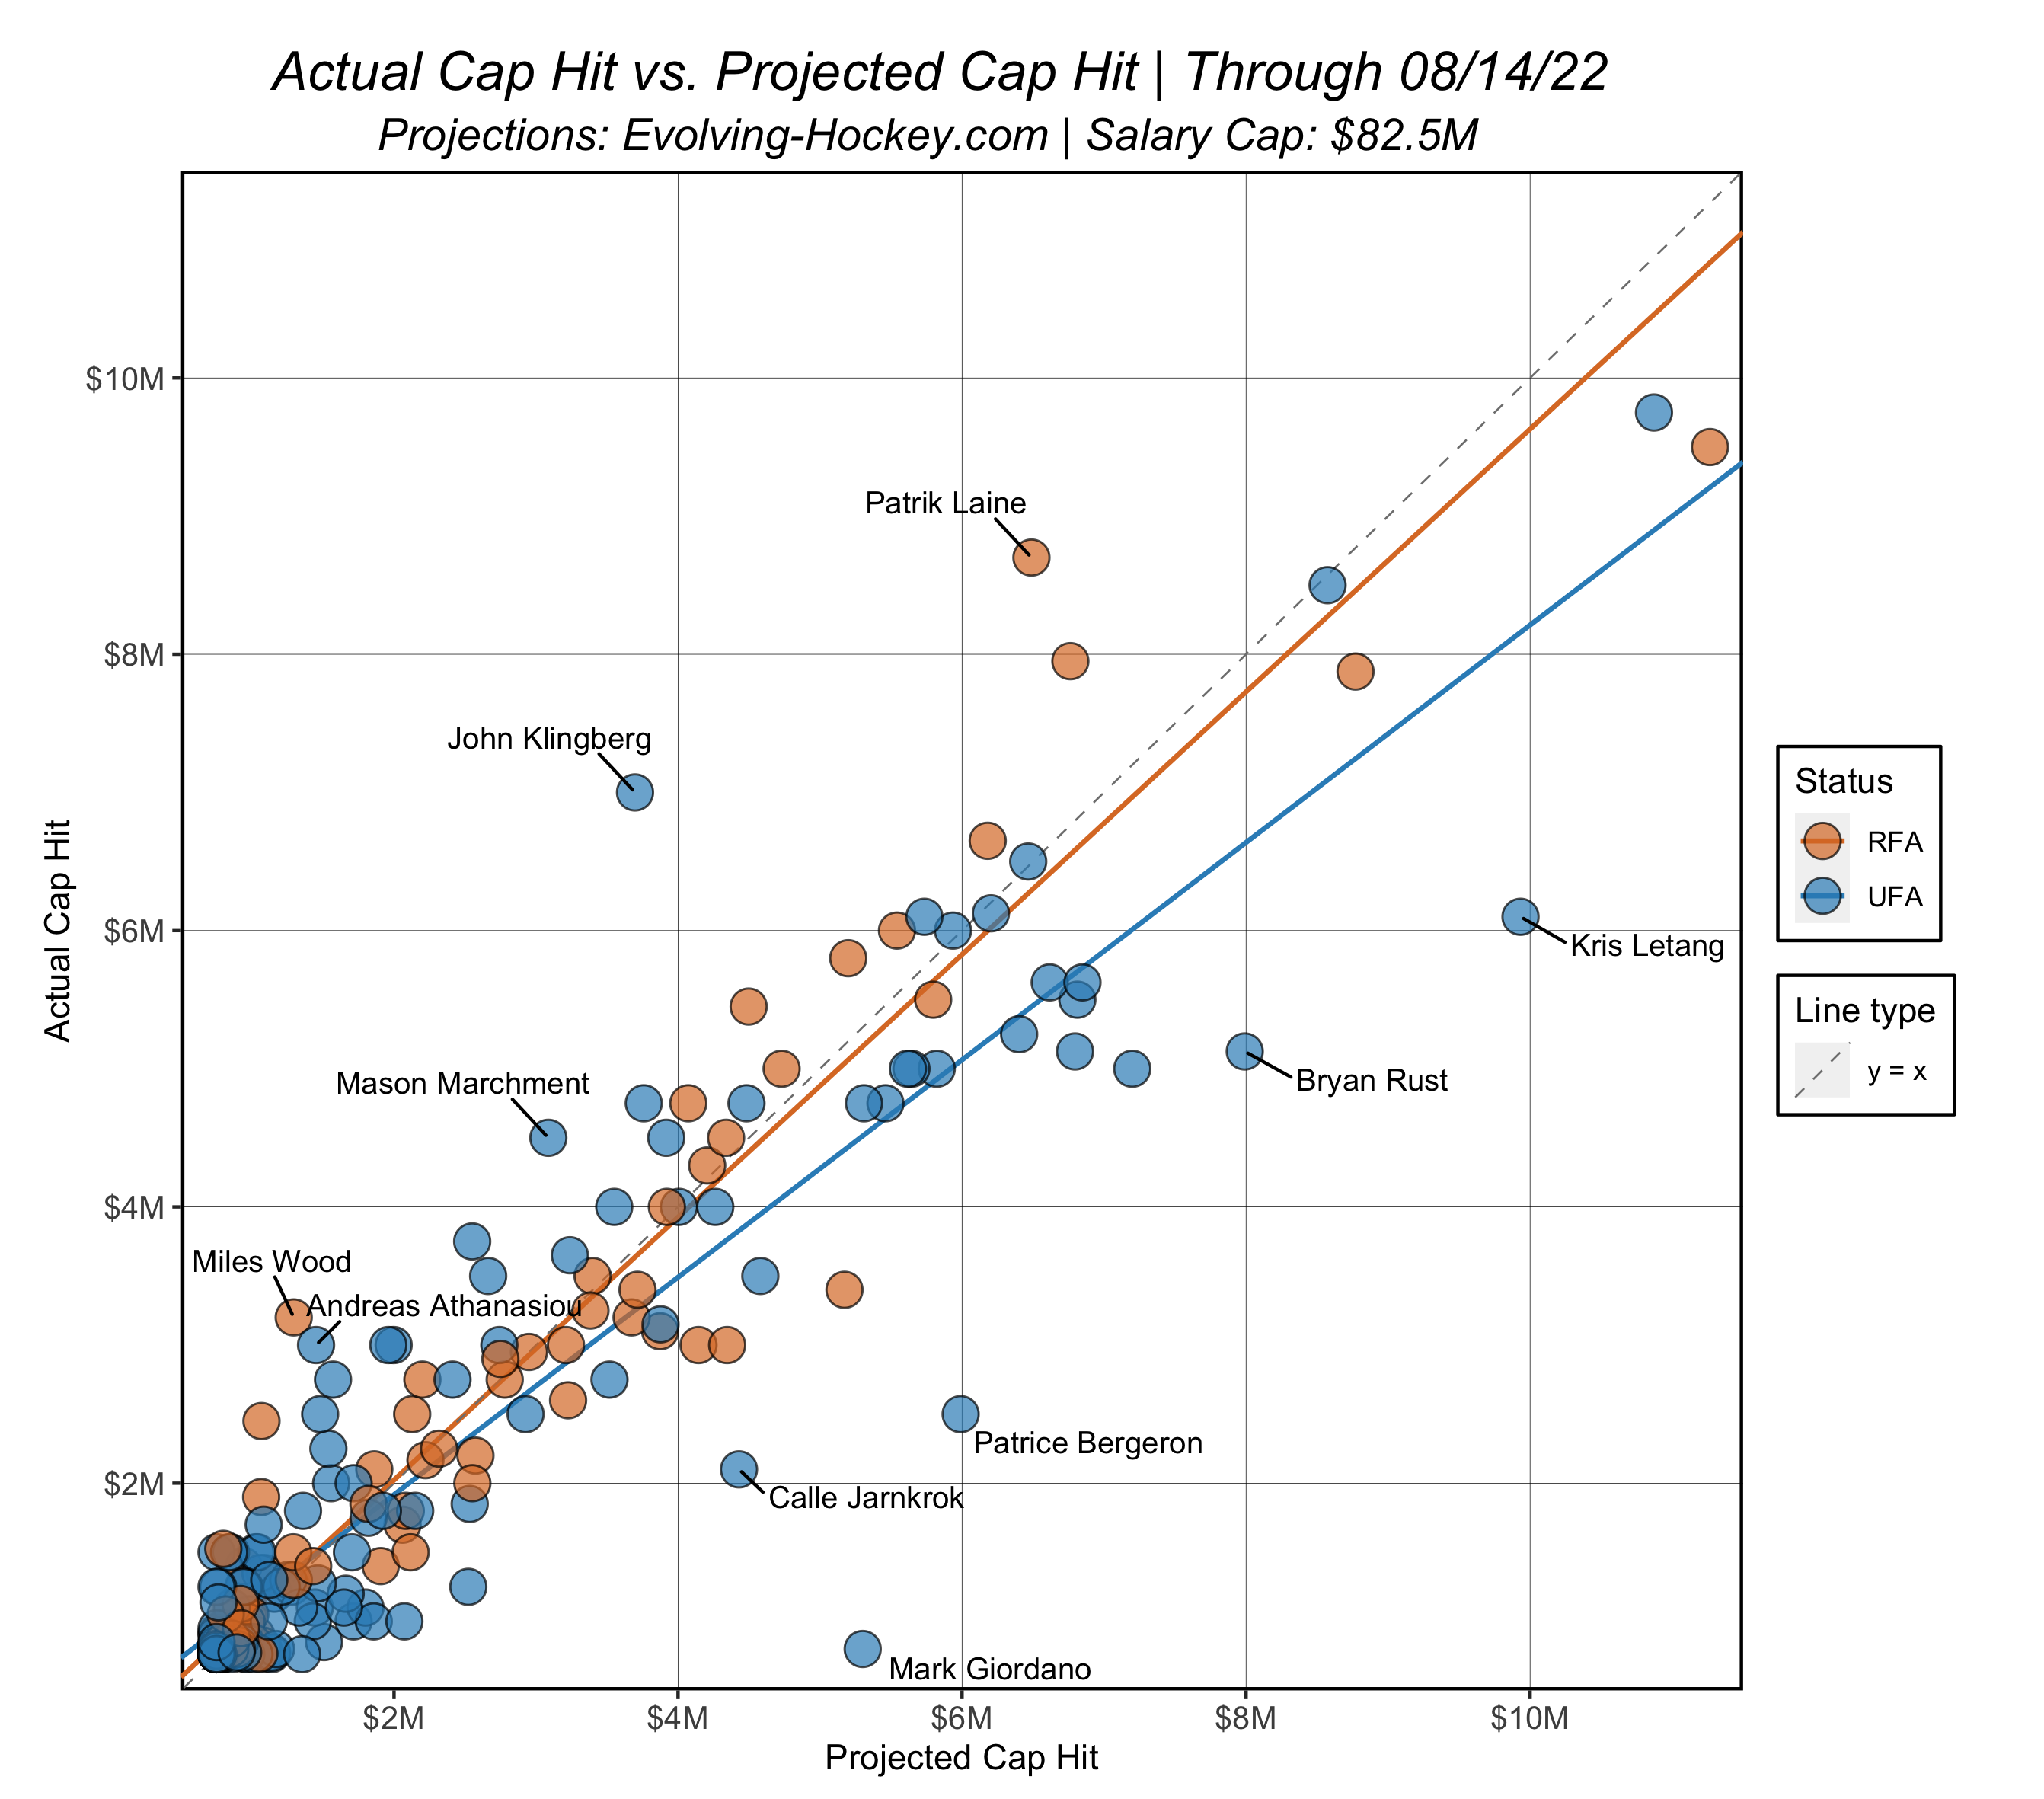
For reference, I’ve also included the y = x line as a quick guide (we’ll get to trends a little later). Below the line = an “underpay”, above the line = an “overpay”. Remember, this is all relative to our projections. Here is the breakdown of UFAs and RFAs highlighted by color:
And finally, here is breakdown of UFA / RFA contracts from a pure evaluation standpoint:
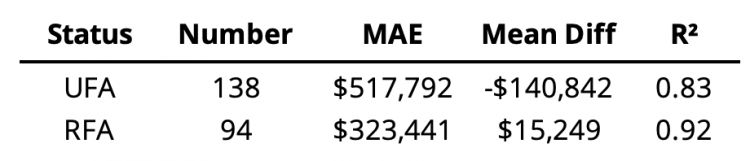
First, the model has performed quite well overall this year – last year, our R2 was essentially the same. One thing that’s quite different this year, however, is what is driving the performance. The model has been more accurate for RFAs and less accurate with UFAs. The reason for this is somewhat obvious: UFAs on average were paid less than expected according to our model. $141k less to be more accurate. Now, there are several contracts that are causing a major shift in the trend line here. A few of these were likely just misses by the model (Jarnkrok, Rust, Letang, Strome, for example). But Mark Giordano’s absurd $4.5M underpay and Patrice Bergeron’s $3.5M underpay feel like distinct outliers. Removing just these two contracts from evaluation increases the overall R2 from 0.86 to 0.89 and the MAE decreases by ~$40k. For transparency we’ve kept these here, but these contracts are both unprecedented and likely unique for future salaries.
UFAs are being underpaid on average – especially players that we would historically expect to make more than most. Interestingly, this differs quite a bit from previous years. At least with our model, the opposite was true in the past – high-dollar UFAs often signed for more than what our model projected. Put another way: it was hard to get the model to project enough players high enough. Due to the heteroskedastic nature of contract data in general, projecting players who are likely to make more money than average (usually >$3M per year) is much more difficult due to the limited number of contracts in this range along with the larger variance in possible outcomes for these players.
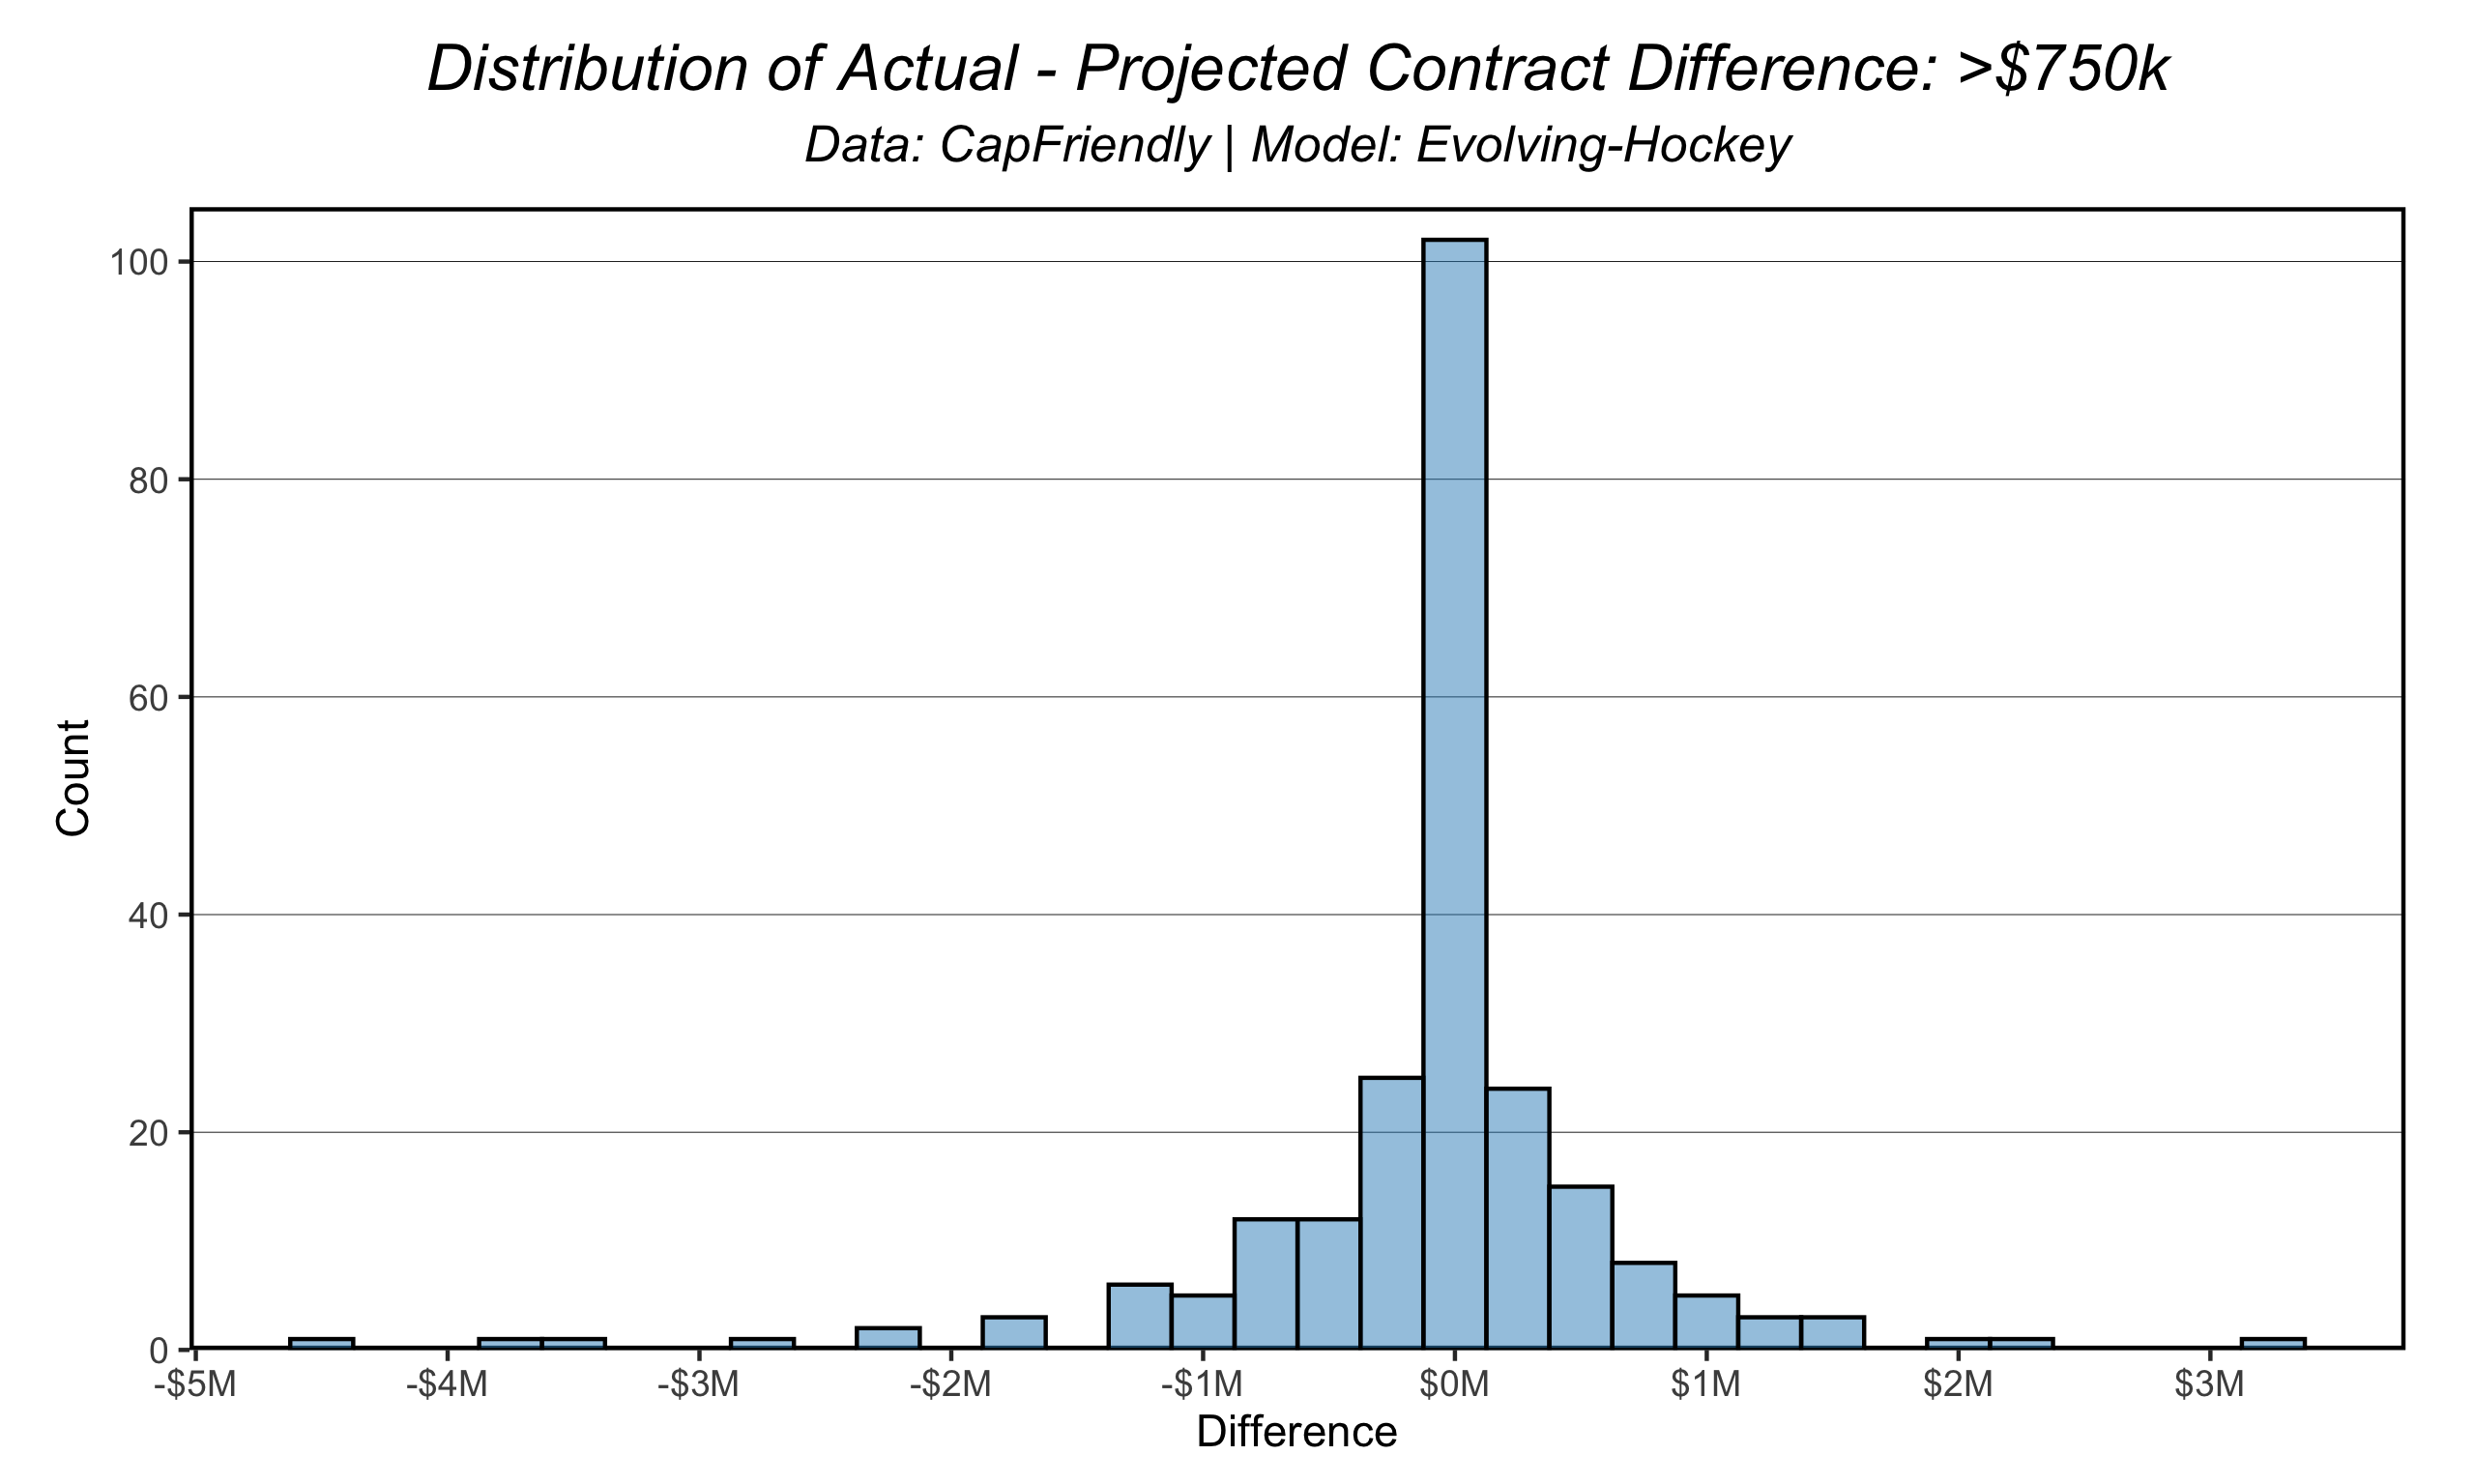
Here we can see the distribution of actual – projected contracts so far. Overall, 72% of all players have signed within $500k +/- of our projected value. However, there is a slight shift in the distribution here towards the “under” side even disregarding a few of the outliers that were already mentioned. But the skew is small, which makes it tough to say with certainty why this is happening. Is it the flat cap? The free agent class? A fluke? Lack of data? I think at this point, there is some legitimacy to the idea that teams just don’t have as much money as they did say 5 years ago. What’s interesting, however, is up until this season, teams were still spending like they did. And one could even make a case that not a lot has changed.
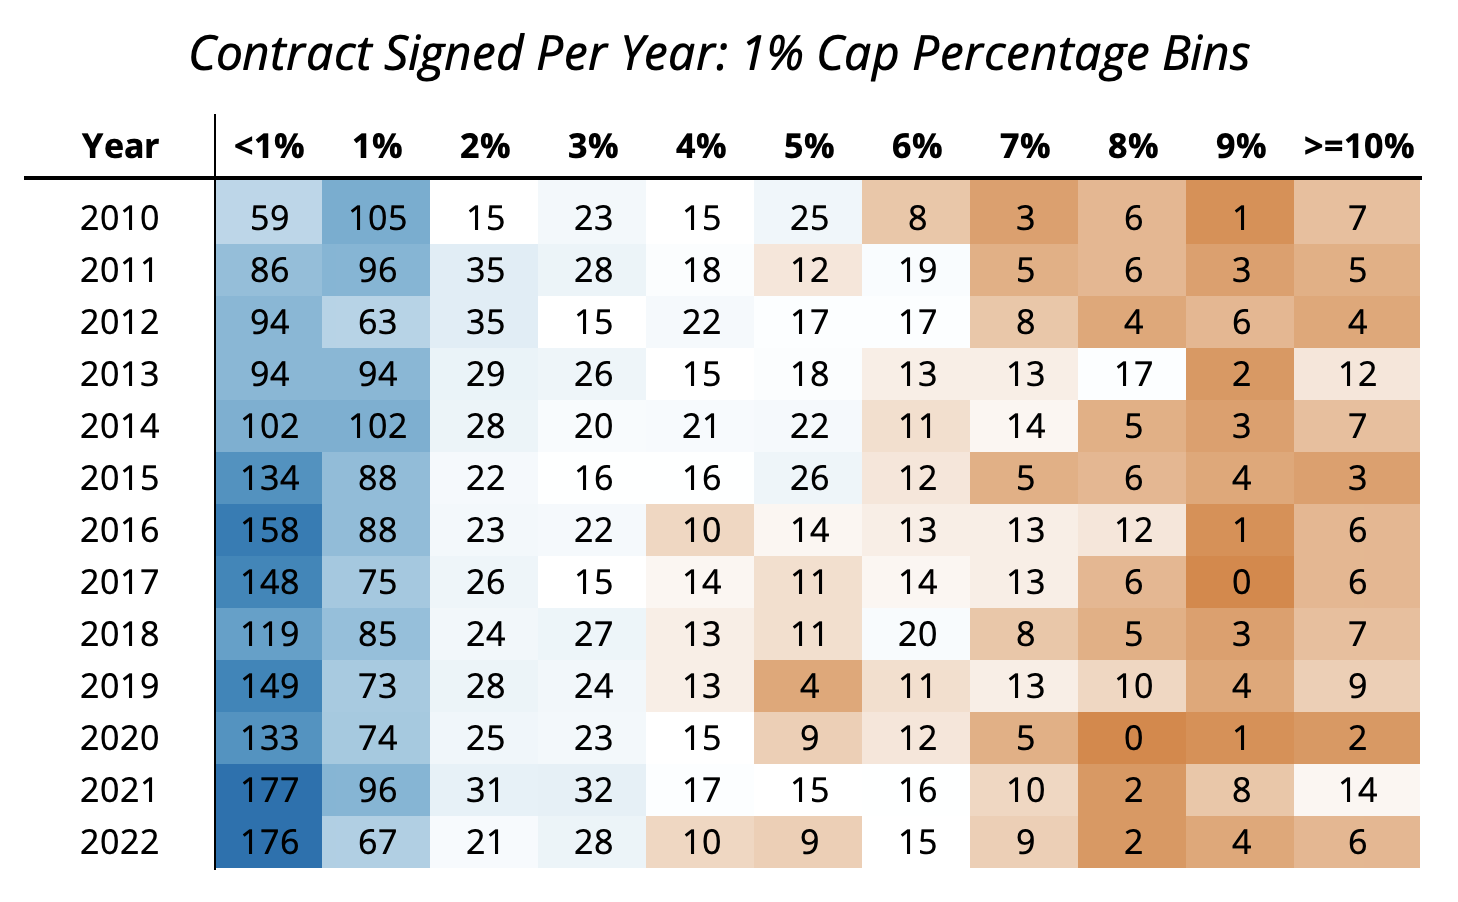
The above table shows contracts signed since 2010 broken down into 1% cap percentage bins (cap hit / salary cap in a given year) – for instance, the 1% column includes all contracts greater or equal to 1% and less than 2%. For reference using the current salary cap, each percent increase corresponds to $825k; 2% is $1.65M, 3% is $2.475M, and so on. Bins are obviously not great, but this is mostly for demonstration and convenience (histograms can be hard to compare when there are 13 of them).
Trends overall are relatively stable: we see a similar distribution of contracts across the spectrum of possible dollar values between years. As cap % increases, the variance year-over-year increases as well. One interesting thing to note is the uniquely high number of contracts in 2021. Only 2019 and 2013 saw more contracts signed over 7%, and no year since 2010 has seen more 10%+ contracts. The simple explanation for this increase is that 2020 saw so few contracts in this range given COVID’s impact on the league, and 2021 was the natural rebound from the decrease. It’s not just that simple, but this seems like Occam’s razor. Again, we’re not talking about a lot of observations here (it’s actually hardly any). But given the increase in high-dollar contracts in 2021, it makes a bit more sense why the model might project a bit higher $ values than we saw in last offseason.
Ok so I’ve been rambling here in an admittedly boring manner I’ll admit. What does this mean? What’s going on? Is the flat cap ruining hockey? I don’t know, maybe. One thing I think we should acknowledge is a few of the high-dollar contracts signed this offseason that carry some interesting “information” with them. It’s hard to call anything a “team friendly” deal in relation to what a player would’ve potentially received on the open market if they chose to pursue that route, but at the very least Giordano, Bergeron, and probably Letang would have received much larger contracts if they had decided to go to another team. I’m still irritated about Giordano. Who does he think he is helping the Leafs? Johnny Gaudreau decided to go to Columbus, and while it’s not entirely known, it seems likely he would’ve received more from the Flames or Devils for instance. Tkachuk was traded in an unprecedented manner (first sign and trade in NHL history), Evander Kane has baggage, to put it very lightly. This might just be the optimist in me speaking, but it’s hard to capture these things in a model.
Bottom line: I think teams are struggling a bit more than in previous years to sign players, and this likely has something to do with the stagnant salary cap over the last ~4 years, but there are other factors at play that explain at least some of the biggest “underpays” this offseason. It’s kind of boring, but I’m not sure if we can say the “flat cap” has caused the slight underpay-trend we’ve seen so far.
Team Evaluation
Enough of the boring evaluation stuff. Let’s roast some teams, right? Well, not exactly, but every offseason I do like to look at which teams performed the most “efficiently” in a given offseason compared to our model.
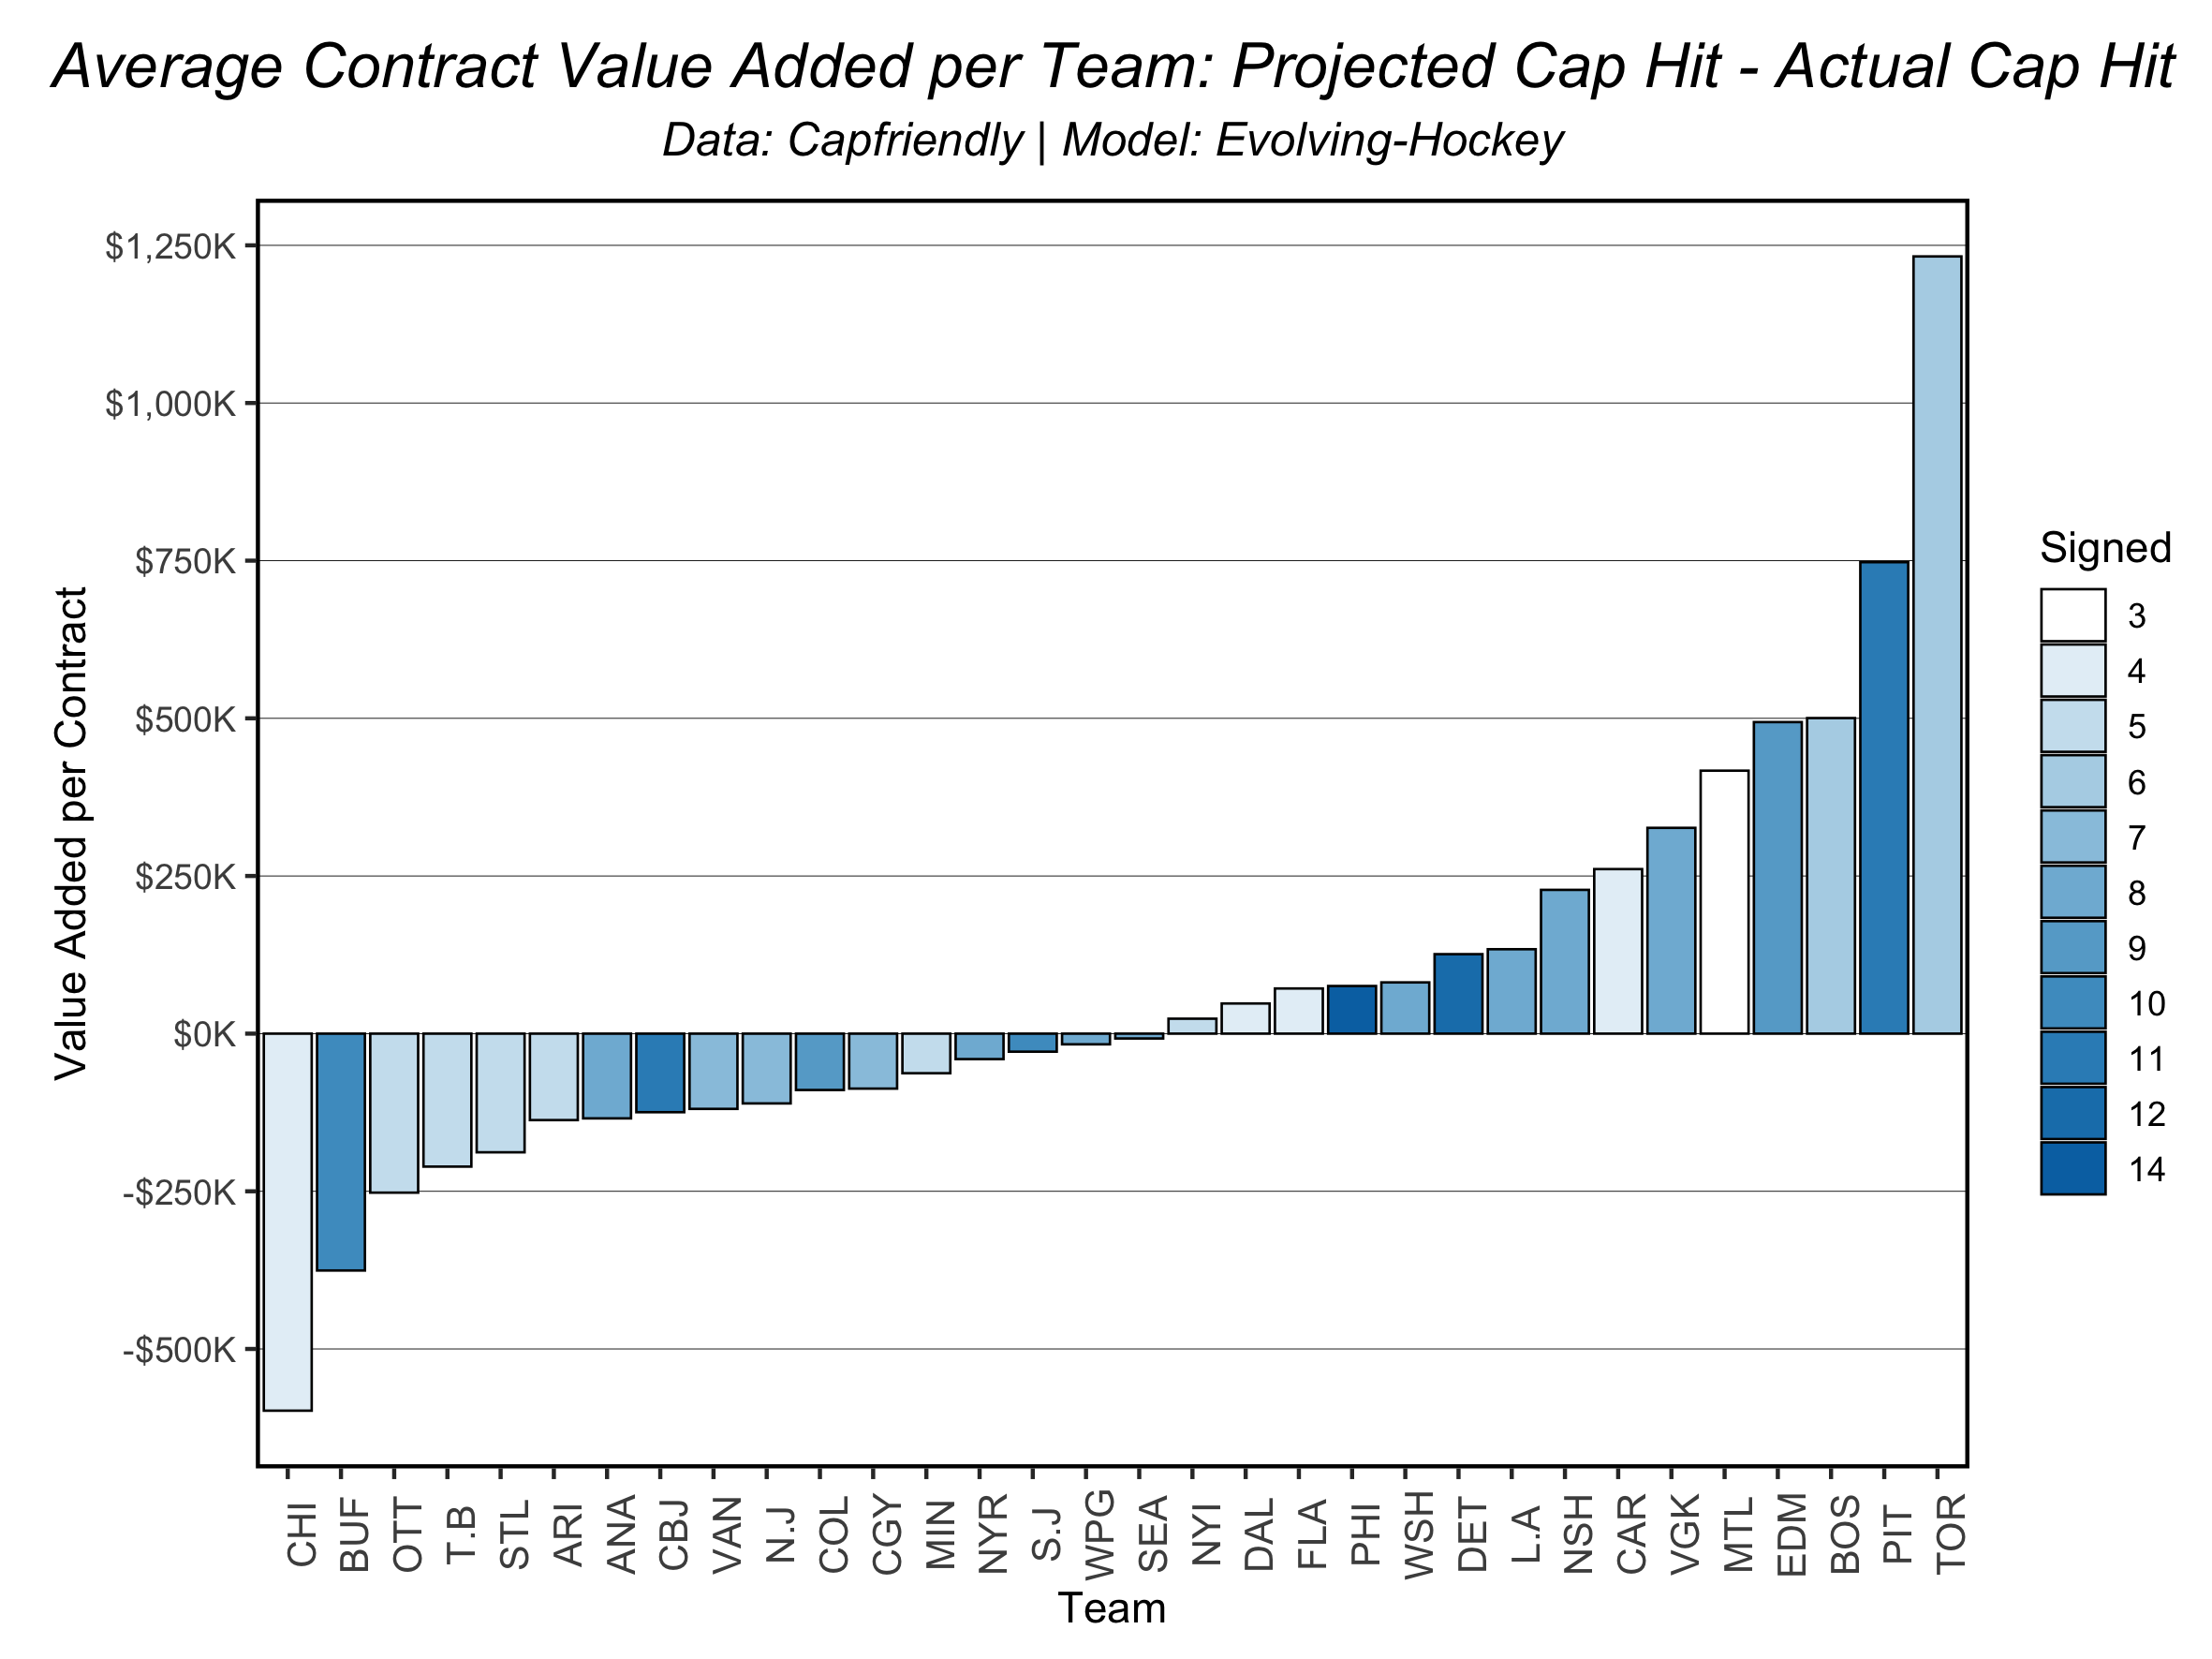
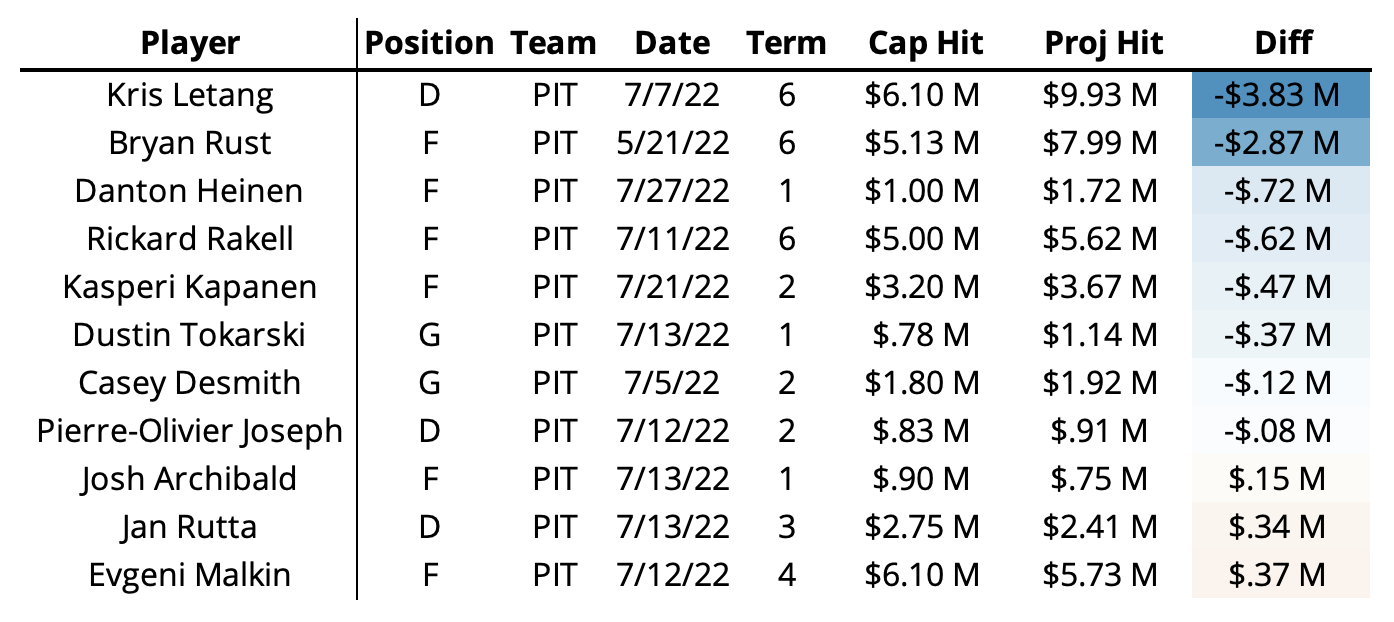
Here we see the average value added for each team. Please keep in mind we’re not dealing with a lot of observations here. The value for Boston, Pittsburgh, and Toronto is a little skewed, but at least two of these teams (more below) were quite efficient in their signings. Let’s look at a few of the teams at each side of the spectrum. To get it out of the way, Chicago has, so far, only signed 4 players, so I’m going to overlook their bar above.
Every player Toronto signed this offseason has been under our projected value. Obviously Giordano is causing a huge skew here, but the Jarnkrok deal is very good. I don’t have much more to say about the Leafs.
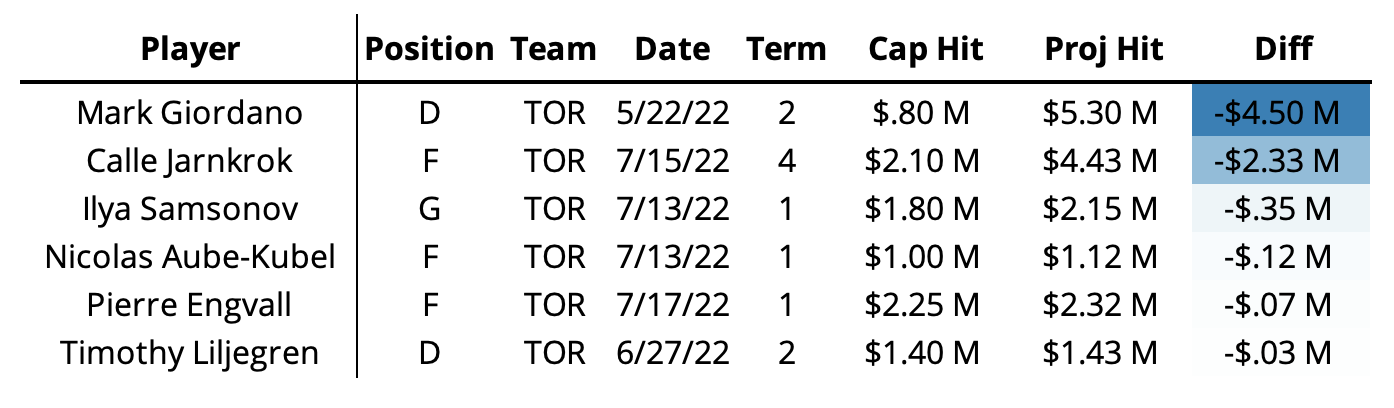
While Pittsburgh signed Letang and Rust to very good deals relative to our projections, they also underpaid 6 other players relative to our projections and only modestly overpaid three players among the 11 of they signed this offseason. Interestingly, it seems not qualifying Danton Heinen paid off. I’m still not sure why another team didn’t offer a bigger contract.
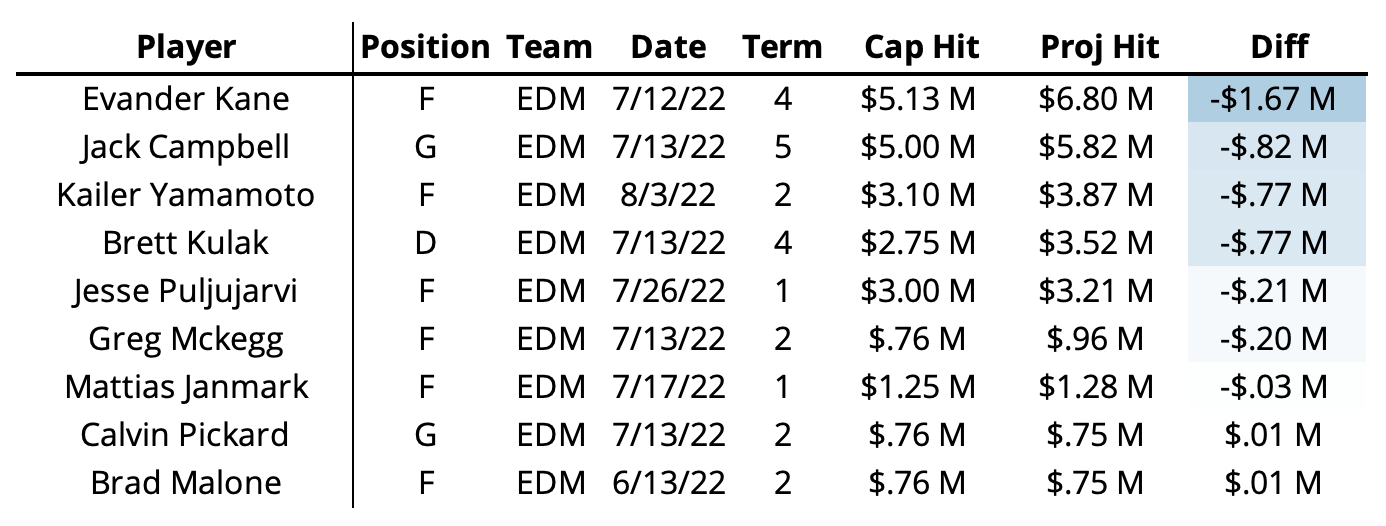
Edmonton’s offseason was good? It’s been a while since anyone has been able to say that, right? I’ve already touched on Kane, but all of their other signings came in below projected as well. If one were so inclined, they might dock points for Puljujarvi’s 1-year deal (he’s the kind of player you want to keep around for a while), but overall, Edmonton’s offseason has been quite efficient. Odd.
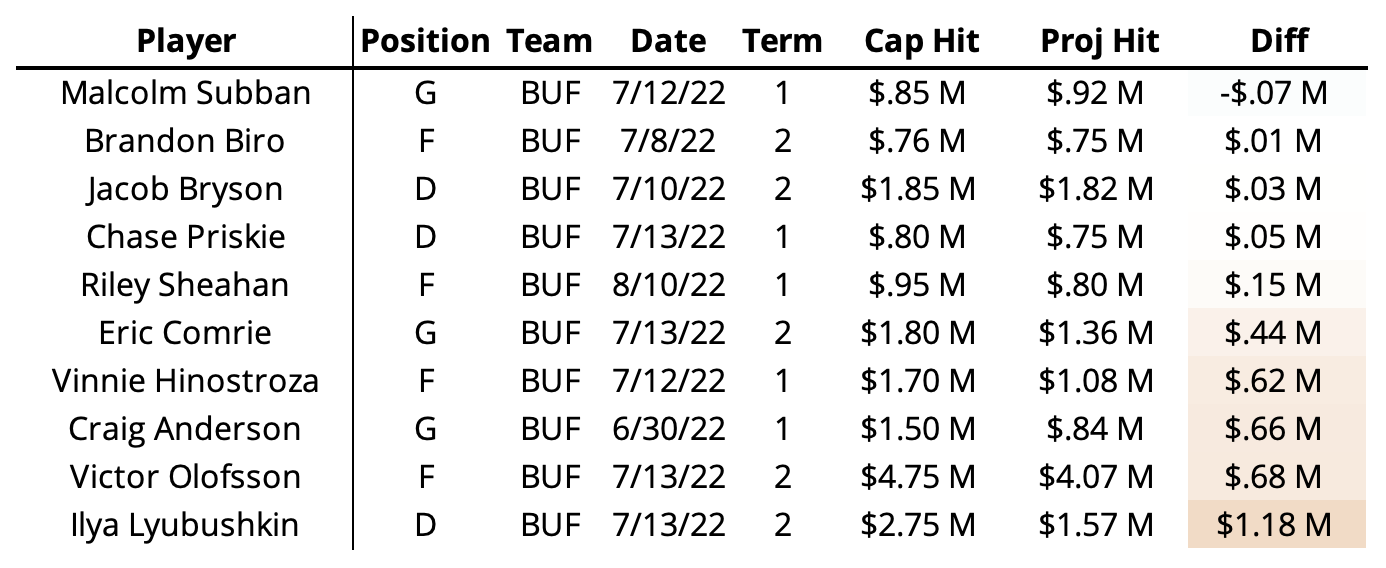
Buffalo’s offseason has been curious. Only Olofsson signed for more than $3M per year – they clearly had no intention of adding a big money player this summer (well, I suppose we still have two months until the season starts). However, they paid more than our projected value for every player aside from Subban. No deal was for more than 2 years either, and 3 of the 8 players they did sign are goalies. These feel very much like short-term-wait-until-we’re-ready moves for the future. Who needs to add Klingberg when you already have future star Owen Power?
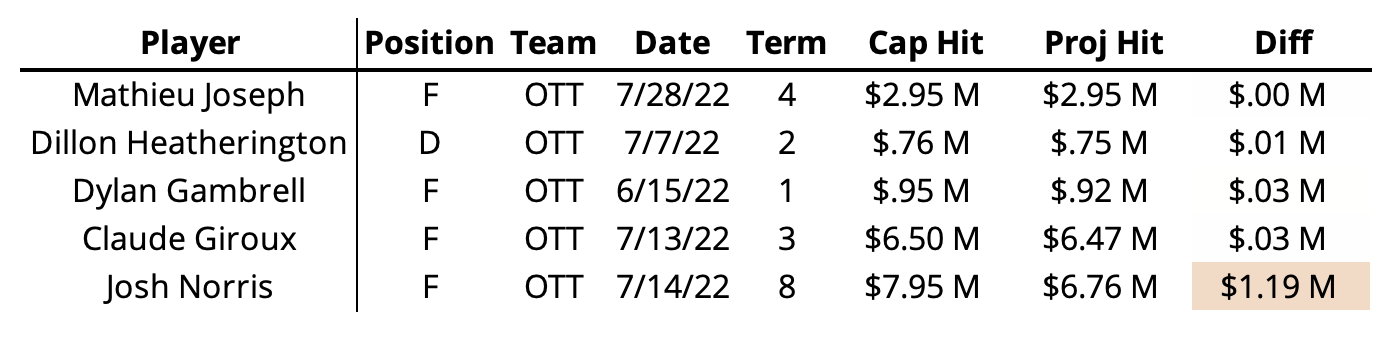
While the narratives around Ottawa were quite positive, 4 of the 5 contracts they signed were exactly in line with our projections. With so few contracts, it’s hard to say they performed poorly given the Norris deal is skewing things a bit. From this perspective, Ottawa is a little boring. I’m mostly just talking about them to show off I guess. Look at those differences.
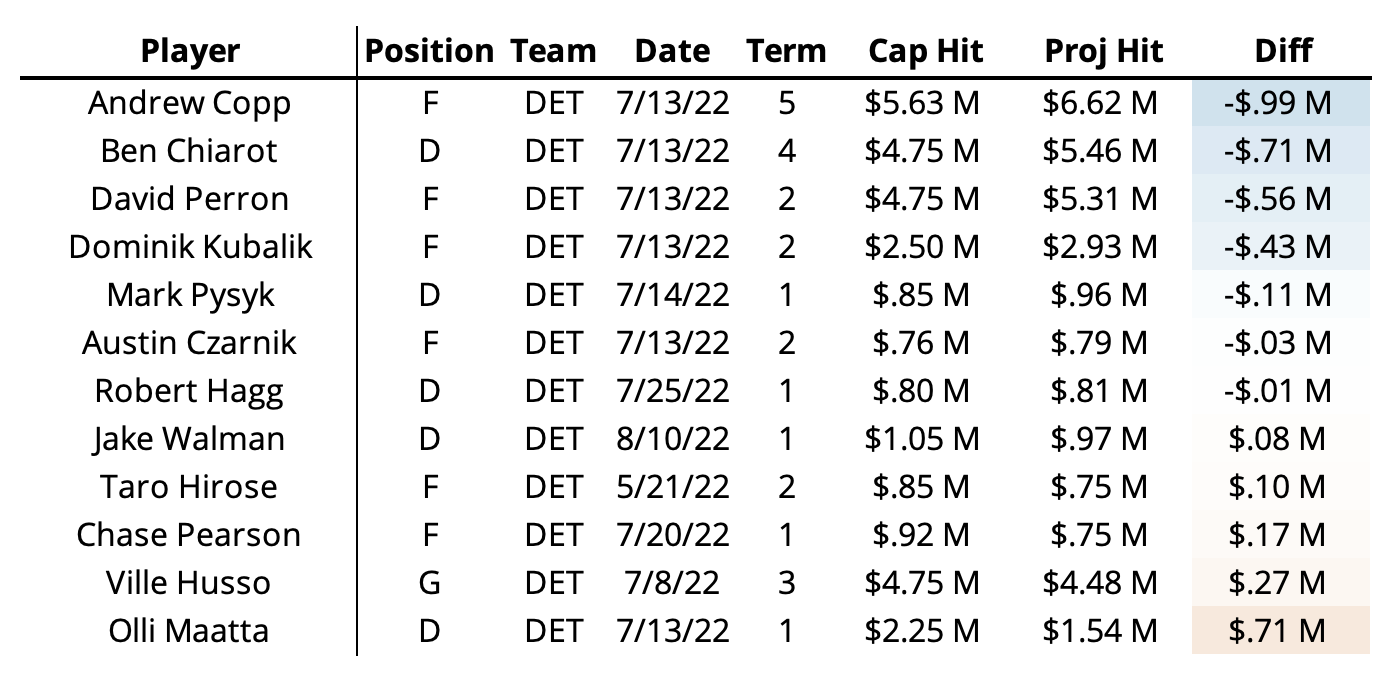
Finally, here’s Detroit. Only Philadelphia has signed more players this summer (one more). Detroit started their free agency very resourcefully – every player they signed within the first two days was below our projected value. Since then they’ve been much closer to our projected values. We’ll get to player value next, but a few of these seem like great value adds (Copp, Perron), and a few seem like the opposite of that.
Player Evaluation
Finally, let’s get to the player value part. Like last year, I’ll be comparing the difference in our contract projection and actual contracts to the GAR projections we host on the site. And like last year, I’ll throw the disclaimer out there that our GAR projections only cover the upcoming ’22-23 season. We don’t project “career” GAR or consider aging here, so this is somewhat limited. However, it’s a good starting point for comparison. In our free agency preview from earlier this summer, I looked at free agents from a WAR-based cost-per-goal viewpoint. I didn’t do that here, mostly for space-sake, but heading into the season, we may revisit this in another article. Either way, it’s an interesting read given what we know now.
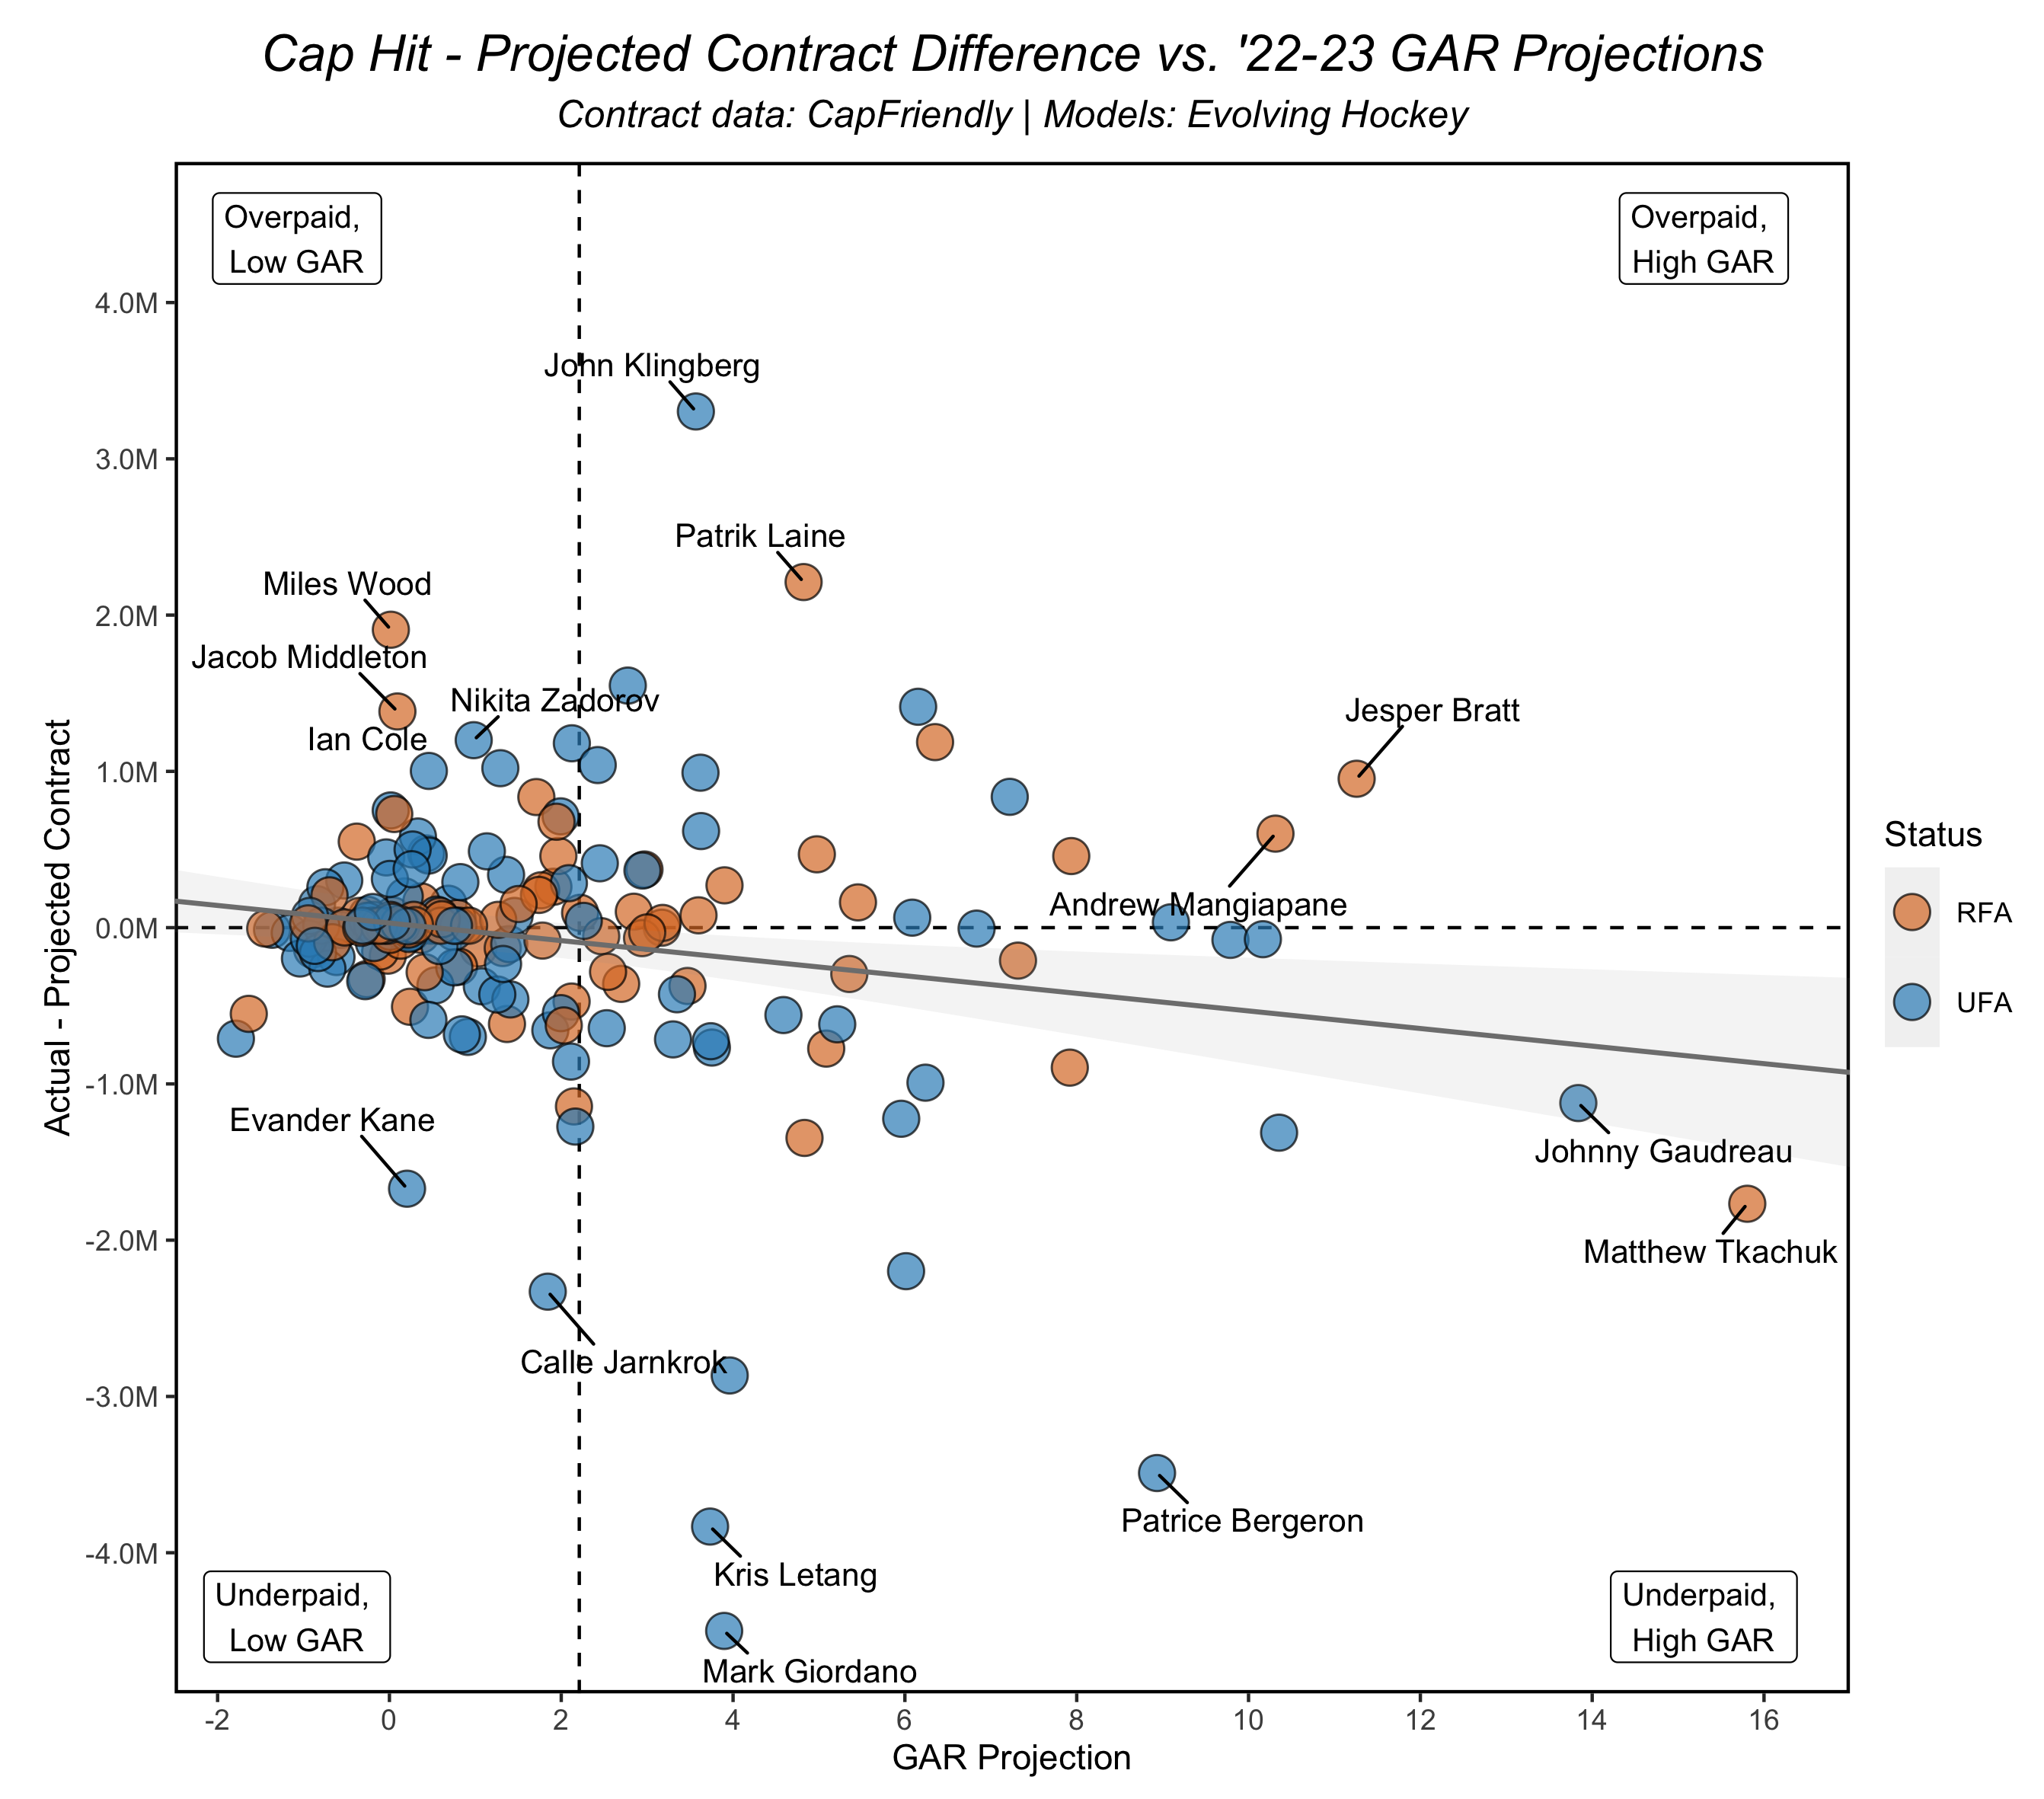
For convenience, I’m going to copy what I wrote last year to explain the above chart:
- I’ve divided this into quadrants with labels for each. This is not scientific in anyway necessarily, just a guide for what the chart is showing. Please don’t get mad at me for using underpaid and overpaid. That’s not really what this is, but it’s the simplest and shortest way to label this.
- For continuity, I’ve kept both RFAs and UFAs in to show all players
- The players labeled are the outliers – not in the statistical sense of the term, but based on where they fall
Interestingly, we see a similar trend with last year: players are generally still underpaid relative to their expected talent/value (our GAR projections). This isn’t entirely consistent however: players who we expect to be below average next season (the dashed vertical line) are closer to even. Also, just like last year, we see more players in the “Underpaid, High GAR” quadrant. I haven’t investigated this historically, and our contract projections only go back 4 years, but this seems somewhat noteworthy. We can possibly discount a few of the as outliers, but players like Burakovsky, Jarnkrok, and Strome are the kind of players that smart teams are able to sign to reasonable deals relative to expectations.
While we’ve seen a few more players sign deals under our projections than in previous years, the spread of contract value vs. player value seems to be consistent with previous years. Regardless of the circumstances, we still see a general under-valuation of defensively strong players. There is some weird outlier nonsense going on, but based on our models, Bergeron, Tkachuk, Giordano, and Jarnkork, among a handful of other underpaid players, are projected to add some-to-most of their value defensively.
Let’s combine this and summarize it for teams. As I disclaimed before, we’re looking at a small number of contracts for every team. However, let’s do it anyway.
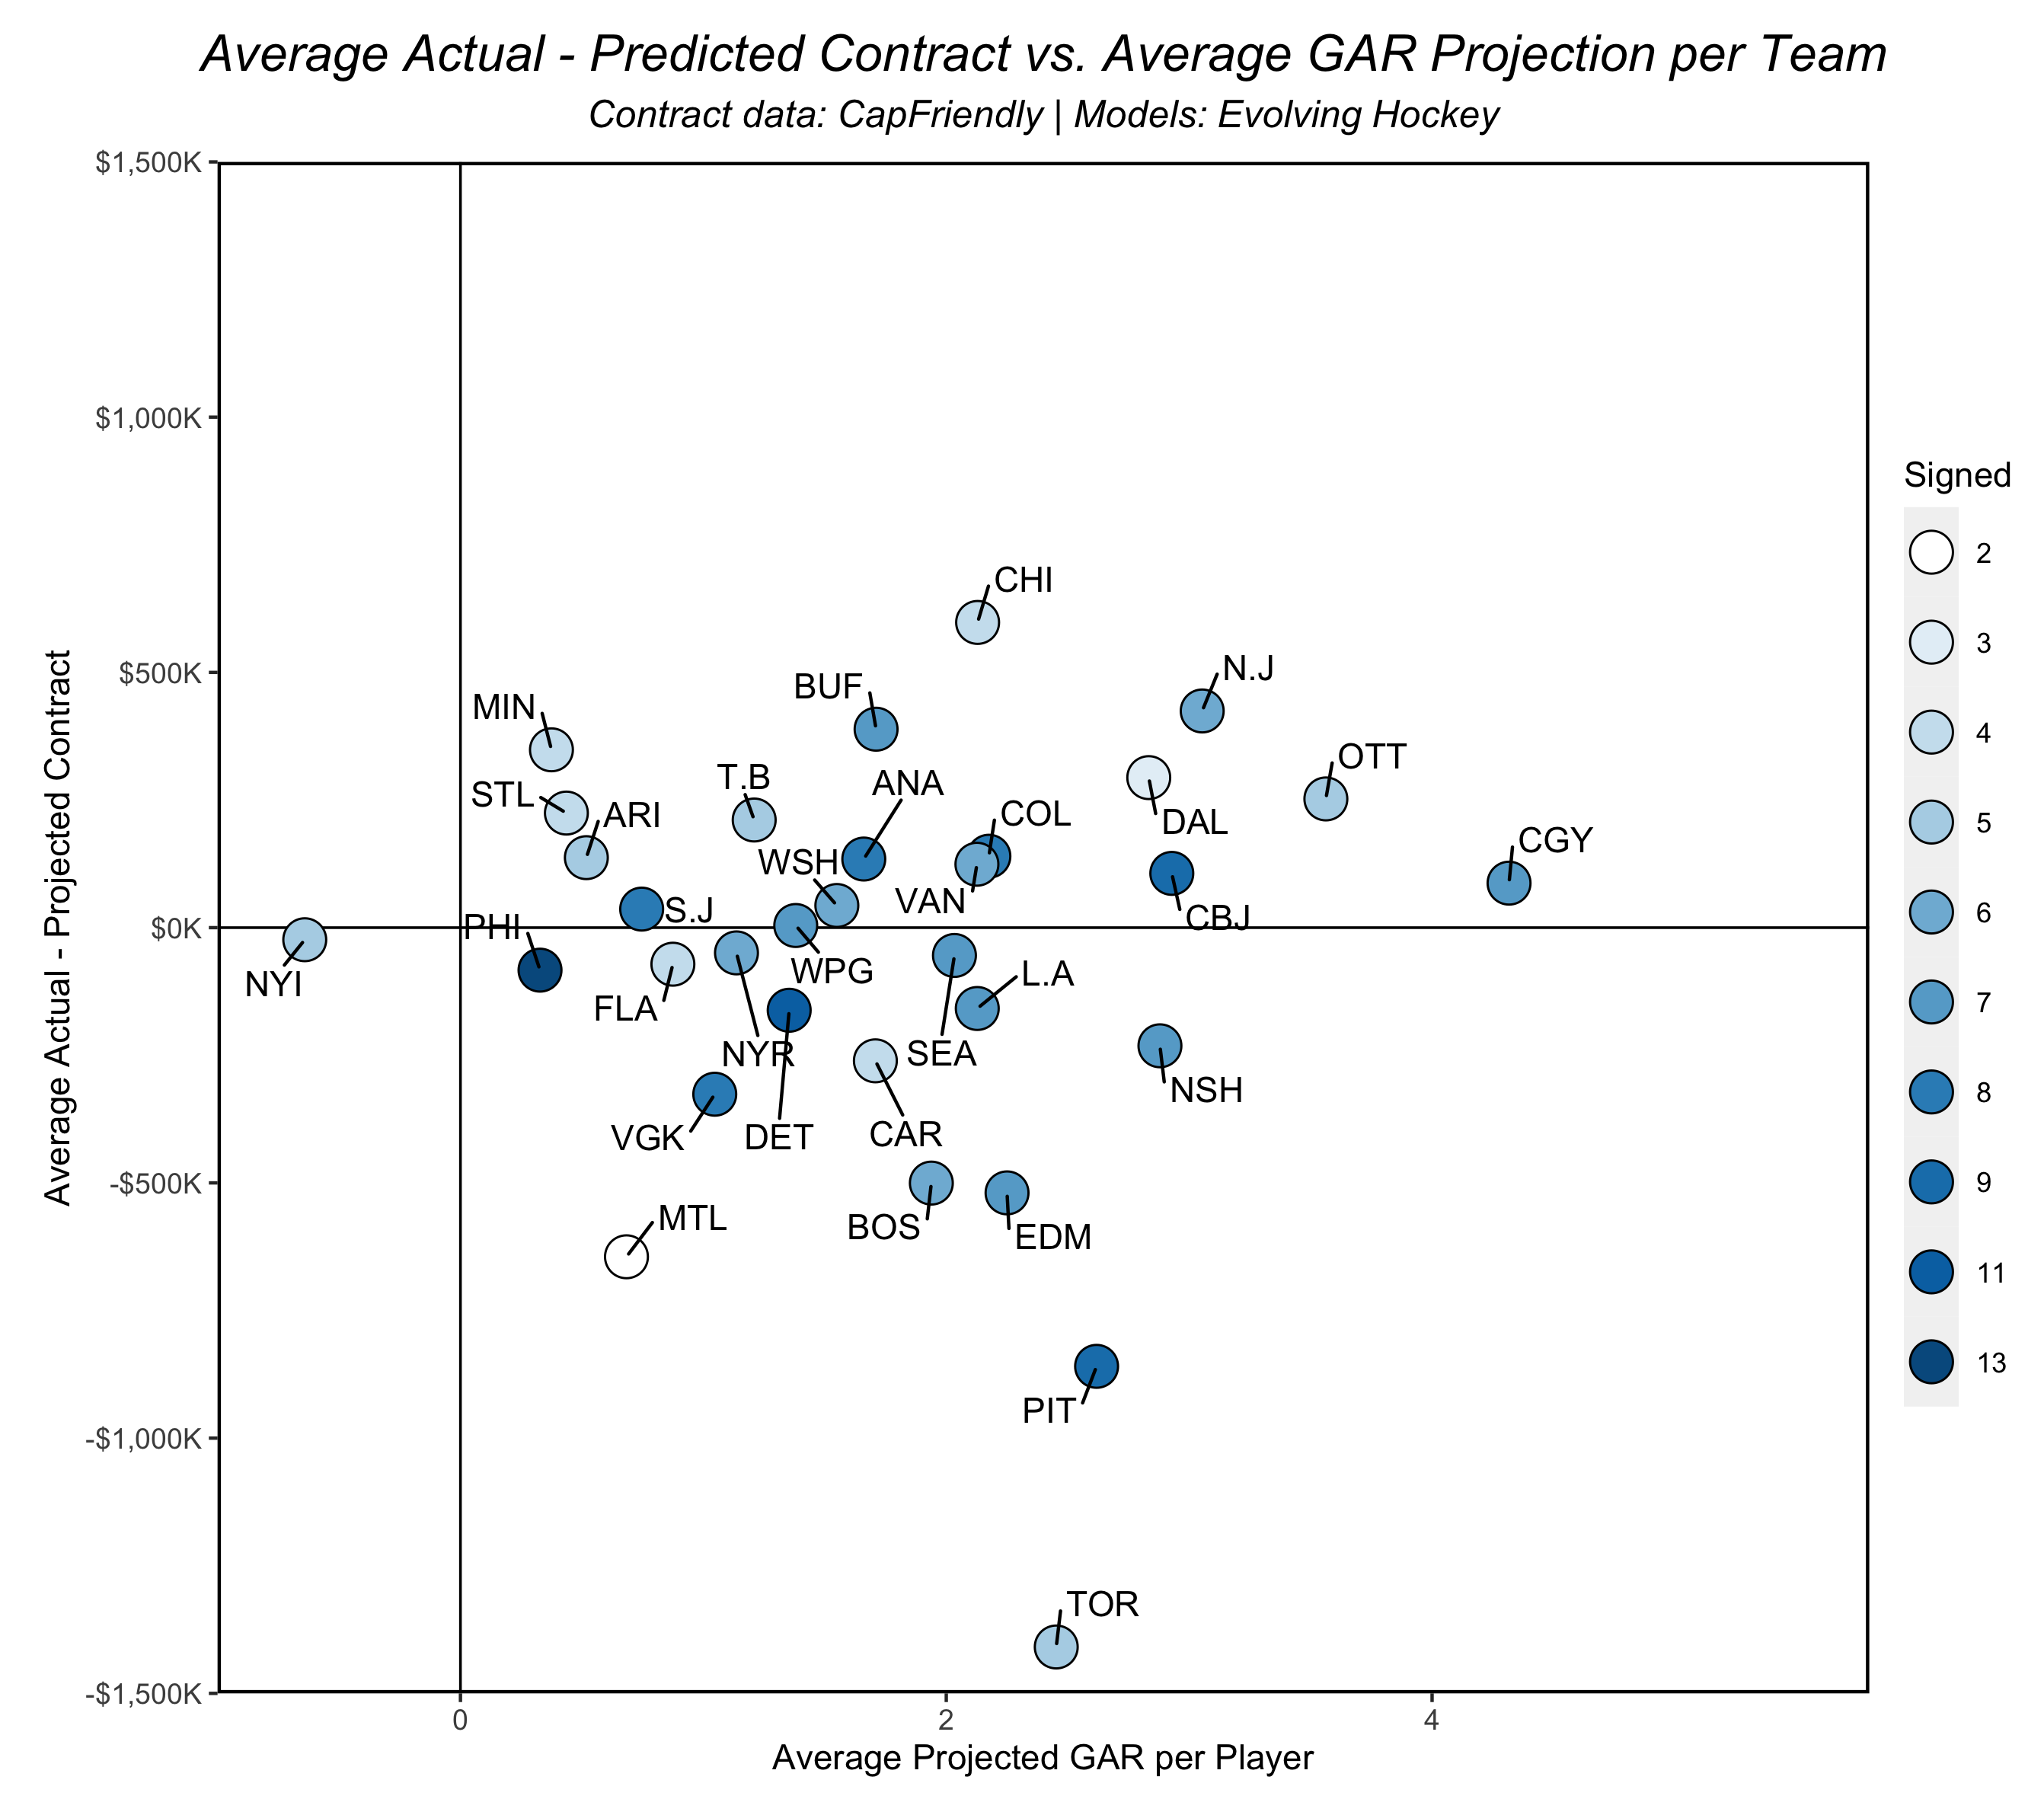
Here we see the spread of actual – projected and expected value (GAR projections) for every team. We’ve covered Toronto too much already, but once again Giordano is causing problems. Mind you, this doesn’t in any way imply any team “won” or “lost” free agency. For instance, Calgary paid a bit more than expected on average, but they signed the most valuable players overall due almost entirely to their RFAs. I should note that Tkachuk is technically considered a Calgary signing. In the future we may deal with this differently, but right now I’m not sure we can treat this as anything else.
Finally, let’s look at the most “under” and “over” paid players relative to our GAR projections:
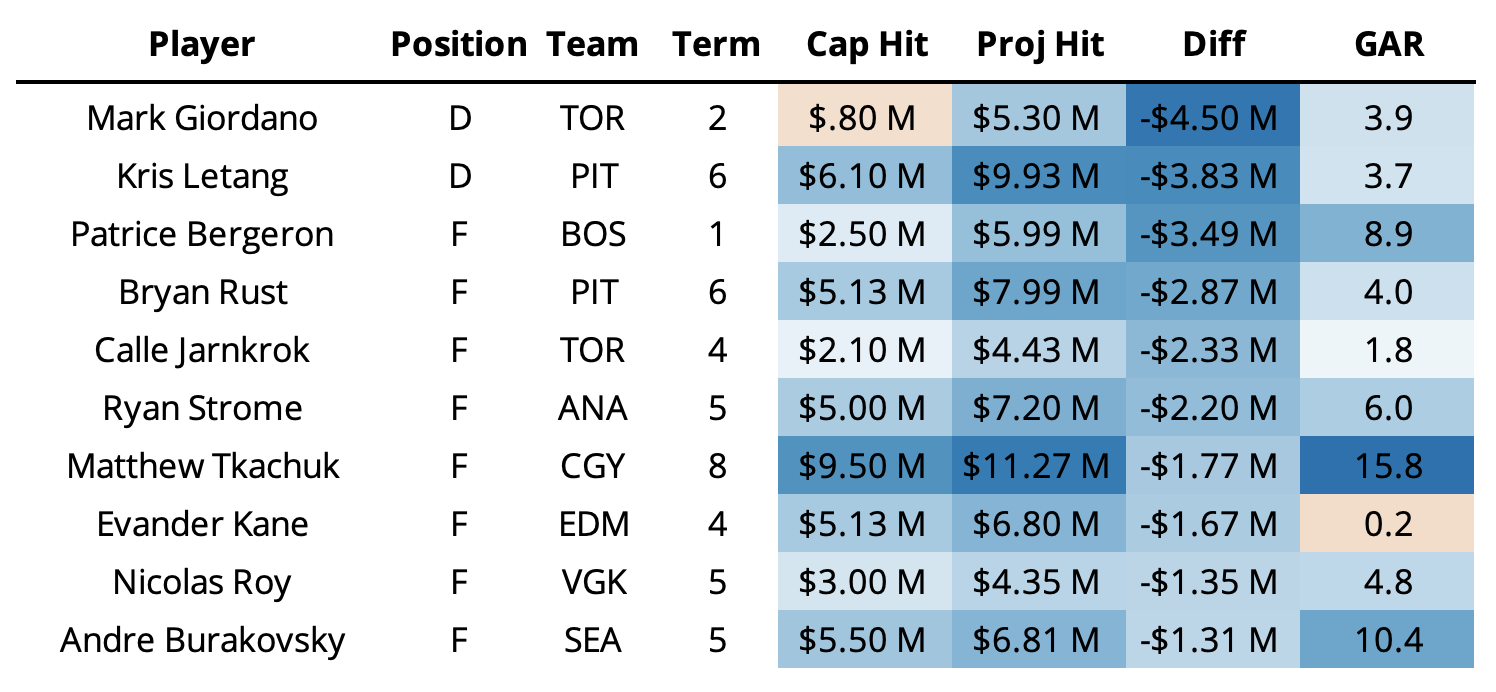
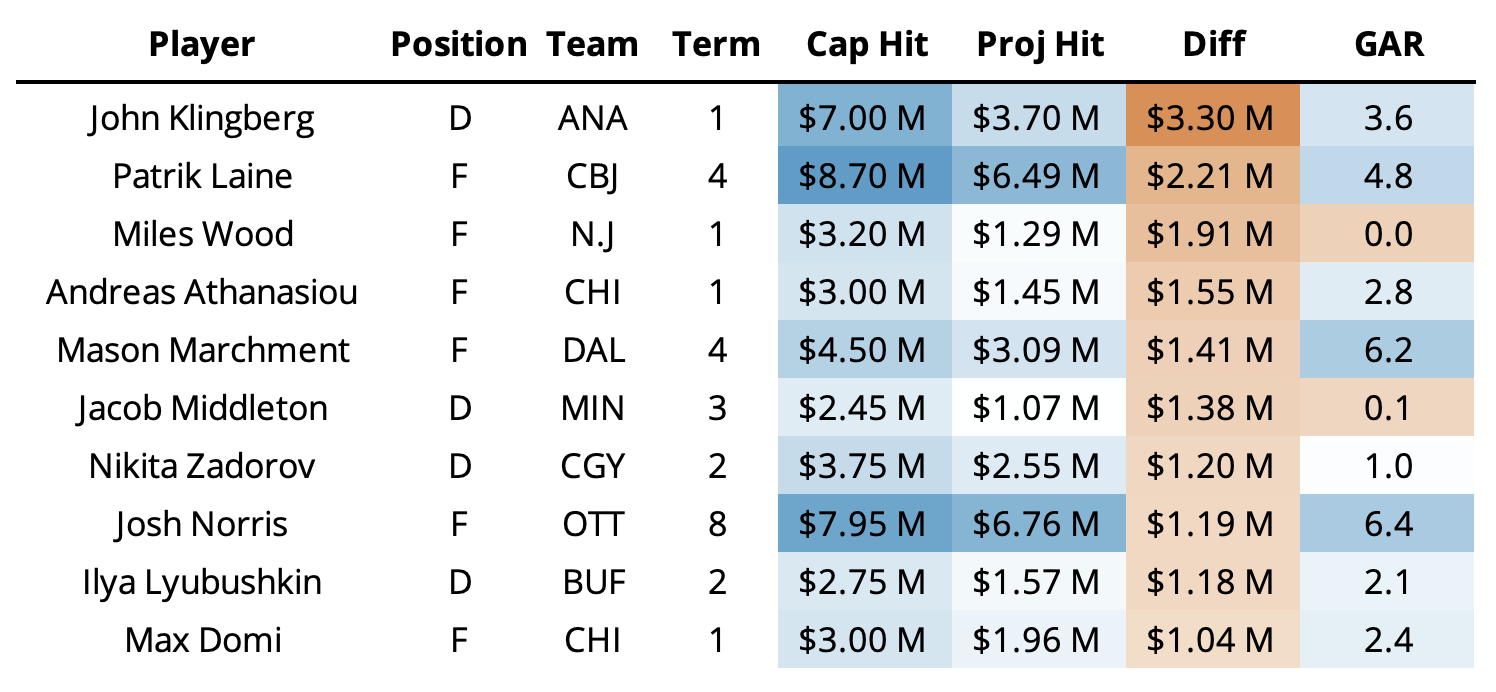
Again we see the outliers, but we also see a few replacement players in each chart. Our models do not like Evander Kane. At all. He’s a classic example of empty points. The models might be wrong about this evaluation, but I guess the Oilers got a good deal for those empty points. John Klingberg is an interesting example of an outlier on the other side of the spectrum. Based on the 7% likelihood of a 1-year deal from the term model, only a handful of players have signed a contract like this given his metrics. Patrik Laine, once again, is causing the model problems. Columbus is certainty going for it this year, and regardless of whether that’s good, we have to respect it. Miles Wood is an interesting example of arbitration effecting a contract. We tried to include arbitration rights in the model, but we found that it didn’t help given the data available to us. Almost half of all players heading into free agency (specifically RFAs) have arbitration rights. It’s hard to determine how those rights will impact a given contract when only a small portion of the population exercises those rights.
Wrapping Things Up
2022 NHL free agency has been interesting. I keep coming back to this word. According to Word’s search function, I’ve used it 12 times among the 3000 words here. I should probably go back and change some of those, but that’s not happening. At the very least, based on instinct alone, we’ve seen more “the model can’t account for this” kind of deals than in years past. Towards the end of every offseason, I always make sure to note anything I want to change or examine for next year. This year, I’m not sure what that might be. Part of me thinks maybe removing a couple contracts might be a good idea. But most of those contracts are for “older” players, and we kind of need more of those. Teams are choosing, more than in previous years, to not qualify players. But this isn’t something we will likely be able to account for until we know about them.
Regardless, unless the salary cap increases significantly in the next few years, I think it’s fair to say we’ll see major changes in how teams handle their players from a salary perspective. Reports seem to indicate (and Tampa Bay looks like they believe) that the salary cap will go up in the coming years. If it doesn’t, things will get weird. I wonder if Kadri has signed with the Islanders yet.