Evolving Hockey Overview
Evolving Hockey provides a wealth of data, models, metrics, and visualizations for NHL player and team evaluation. Teams, journalists, bettors, and fans have used the tools available on Evolving Hockey for years. The information available on Evolving Hockey is unparalleled in the public sphere. In addition, everything found on Evolving Hockey is updated daily in-season. Access to this information is only $5/month. For specific questions related to our subscription platform, please reference our FAQ. The following is a quick sample of some of the evaluation tools you can find on Evolving Hockey!
Goals Above Replacement (GAR)
A foundational evaluation tool in the NHL, Goals Above Replacement (abbreviated “GAR” and often used in its wins / standing points conversion form WAR or SPAR), is a single-number metric that attempts to assign a total value to what each player contributes to their team.. For much more information on this metric, please see our Glossary entry and reference our three-part explainer for more details on the model.
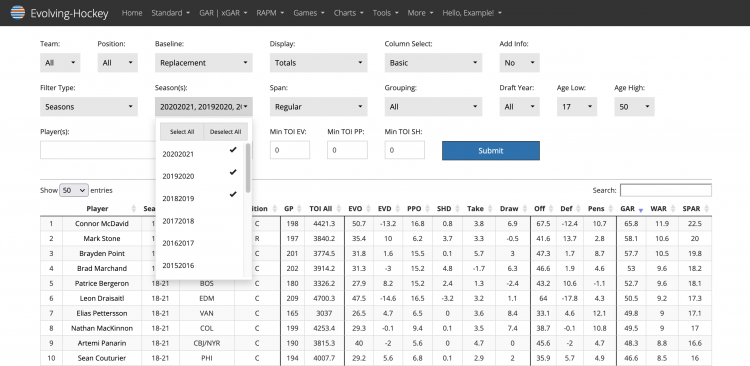
We provide numerous tools that utilize GAR, like our completely filterable tables:
Various visualizations including team ranks, skater percentile charts, and career GAR timelines for all players (below):
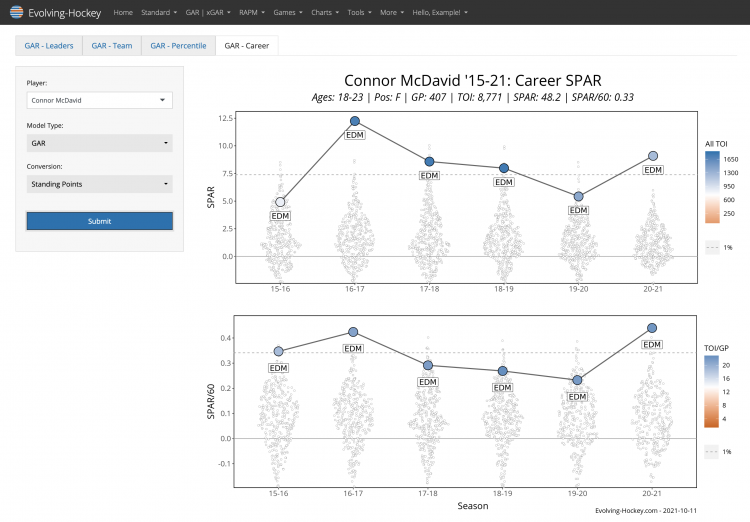
We also offer contract value tools and additional visualizations utilizing our Goals Above Replacement metric. In addition, our Expected Goals of Above Replacement model (xGAR) provides even more metrics and components for analysis that focuses on “deserved” or “expected” evaluation. All of the features that utilize GAR have parallel xGAR pages/tools as well.
Regularized Adjusted Plus-Minus (RAPM)
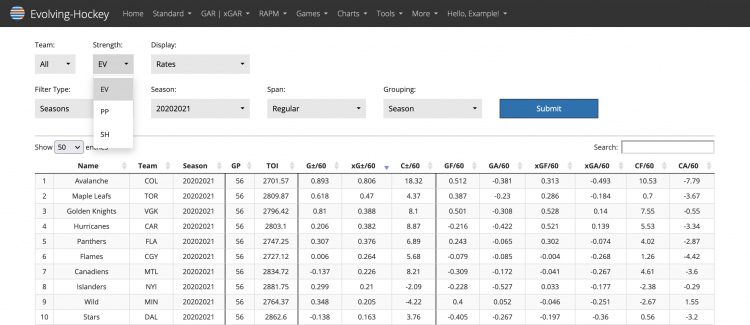
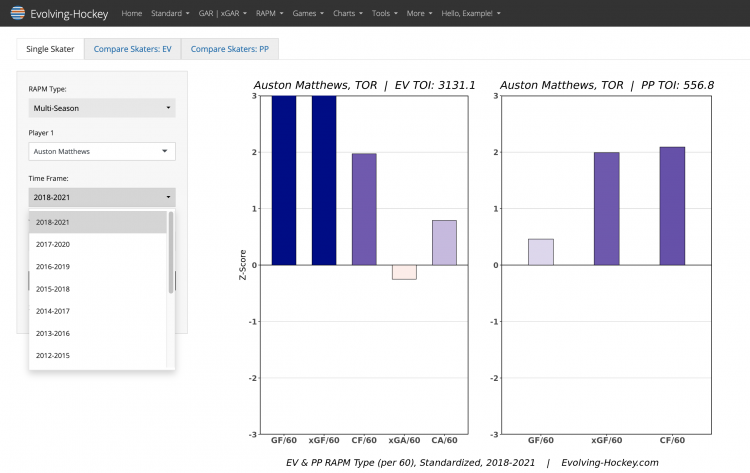
Possibly one of the most well-known “advanced” metrics in hockey, RAPM is a modeling technique that attempts to isolate a given player’s contribution while on the ice independent of all factors that can be accounted for. This model evaluates various shot metrics for skaters/teams (goals, expected goals, shots, shot attempts [Corsi, Fenwick]). Evolving Hockey offers both skater and team level data for various strength states available in both table form similar to the GAR table above, and the more interpretable chart version below. Both single season and 3-year summaries are available in visual form, and our tables allow for any period to be selected.
Skater & Team Visualizations
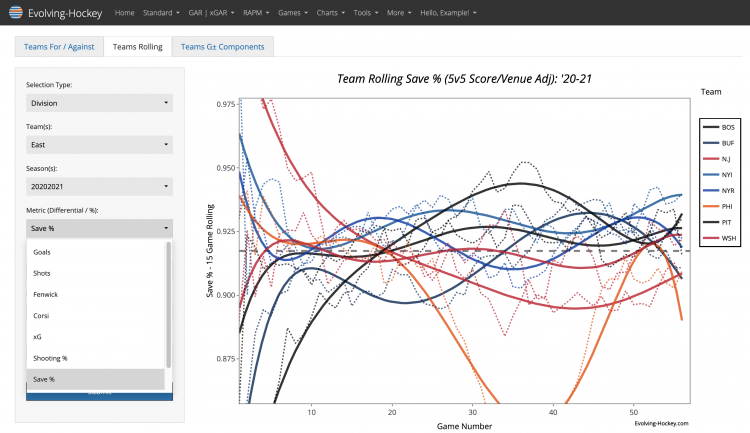
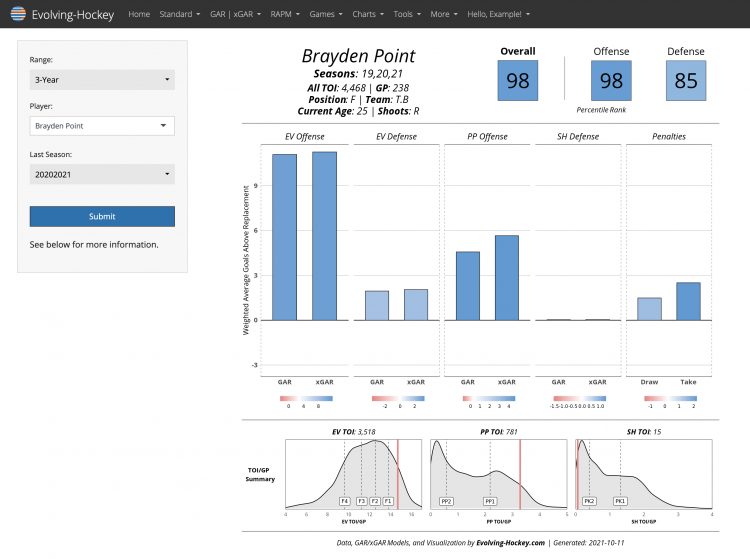
We offer various visualizations for both team and skater evaluation such as team for/against plots, rolling team charts, season-filtered shot location charts for skaters, on-ice skater metrics, and player cards for an all-encompassing view of a skater’s value utilizing multiple evaluation models found on Evolving Hockey.
Projections
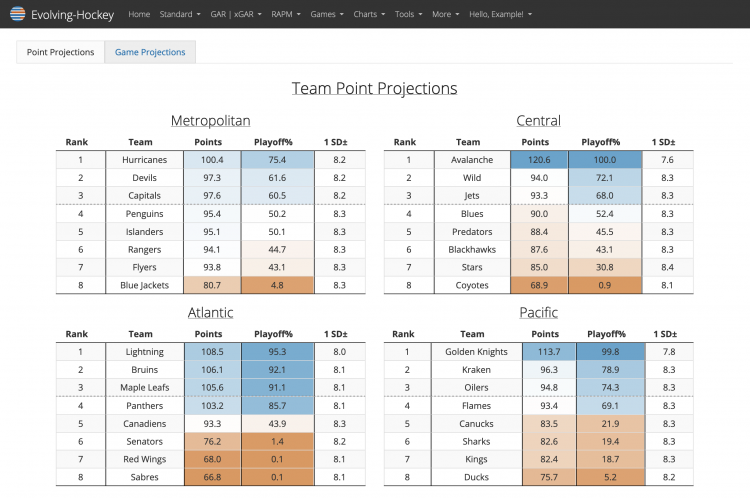
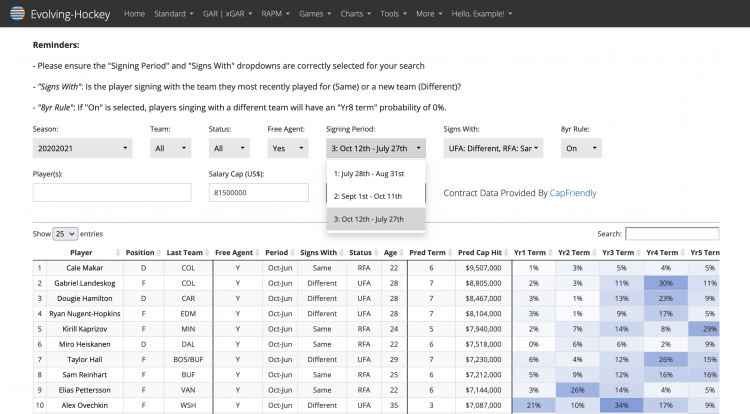
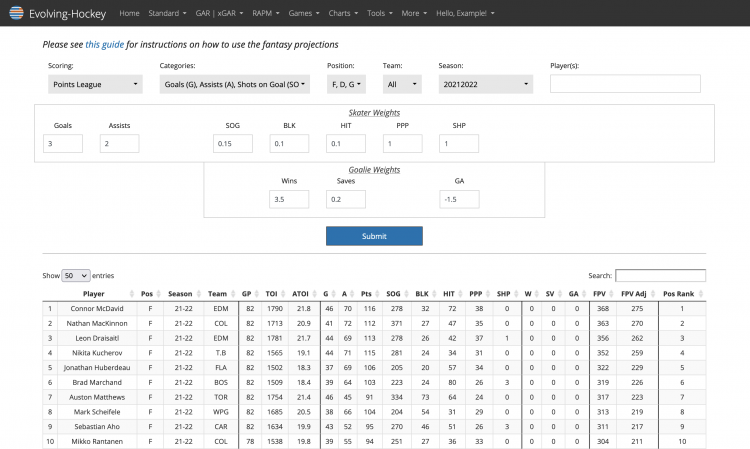
We offer projections for various areas in the NHL including player GAR projections, daily game predictions, team standing points projections, playoff probabilities, contract projections for both free agent and non-free agent players, and a complete fantasy projection suite for both points and categories leagues. When applicable, these are updated daily as well. Below are a few examples of what these pages look like:
Live Game Tools
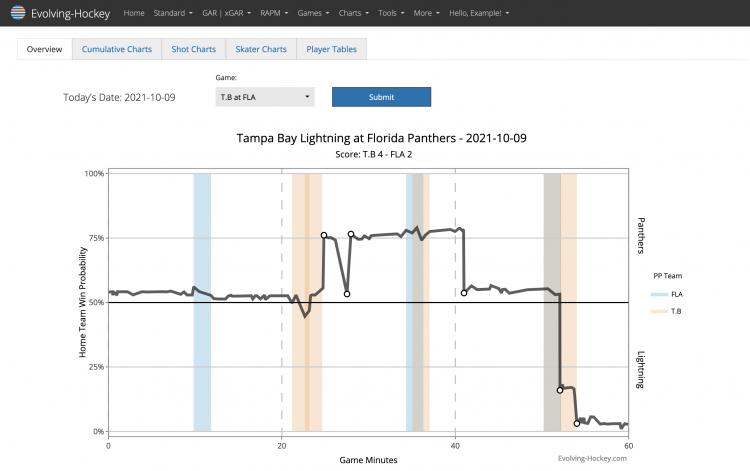
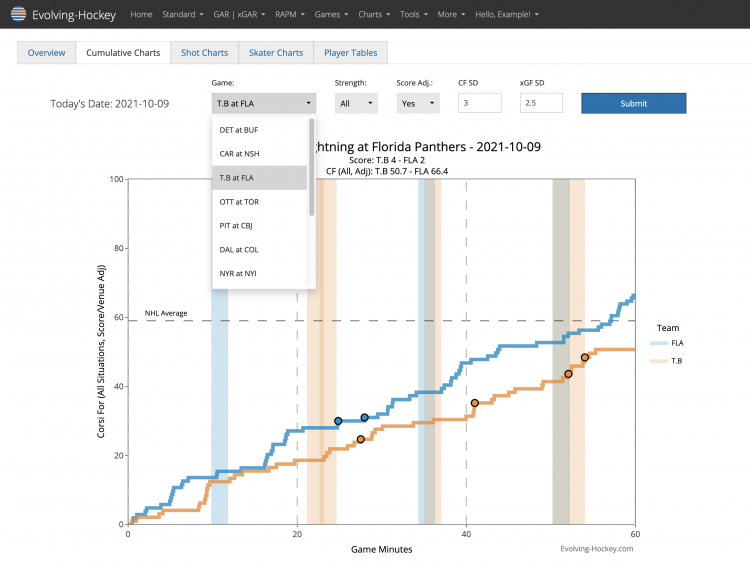
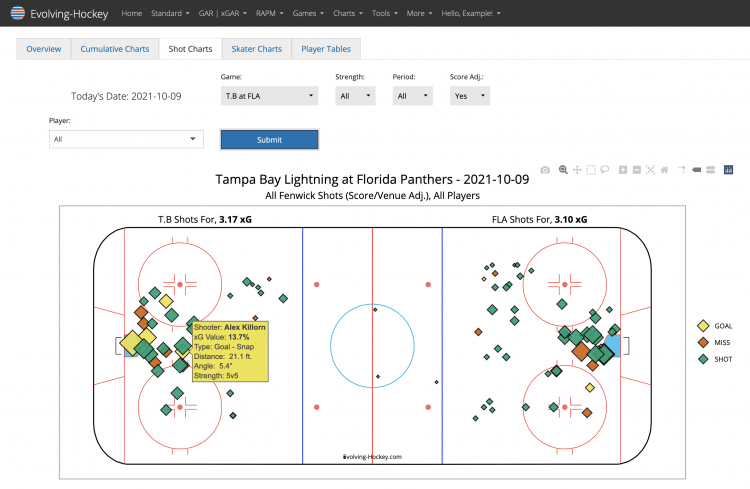
Not only do we offer daily-updated in-season metrics, models, and visualizations like the examples covered above, we have numerous tools and features for in-game analysis, which are updated 30 times an hour during game times. Our Live Games page features an in-game win probability model, cumulative rolling shot charts, on-ice shot locations, skater for/against charts, and comprehensive in-game box score tables for all skaters.
A subscription to Evolving Hockey comes with much more than what is covered above. We’re constantly working to improve the site and make it as user-friendly and understandable as possible. If you have any questions about a subscription, our membership platform, or anything else regarding the site, please contact us via our Contact form or email support@evolving-hockey.com.
– The Evolving Hockey Team