Not much else to say other than it’s that time of year once again, eh? The ’23-24 NHL season begins tomorrow (that’s Tuesday, October 10 in case you’re reading on a day that isn’t today). We’ve endured an offseason that’s felt really really long. In fact, it has been really really long. As I covered in our free agency preview, few things of interest happened. But with a new season beginning, it’s time to put this all behind us and forget about it, like true Midwesterners.
As some of you know, we’ve been projecting team standing points for some time now. We also regularly track multiple public models throughout the season. Last year we did pretty well (yes I’m bragging, this isn’t easy). This year may prove a bit harder given a few of our outliers – spoiler: we’re quite high on the Kraken. But we wouldn’t want it any other way. Before we get into the projections, let’s cover how the model works.
Model Info
This is an updated version of our explainer from the previous description here.
Our playoff probabilities are generated in a three-step process. We use a model to project “future” value for all players, use these player projections to build a game probability model that projects the winning % of any given team matchup using logistic regression, and then feed these individual game probabilities into a Monte Carlo simulation that generates the outcomes for all games in a season. To complete this process, each team’s player projections are aggregated into Forward, Defensemen, and Goalie groups, and various metrics are used for each group which are then fed into the game probability model. With these inputs, we can generate home and away team winning percentage values. Once we have all home/away probabilities projected for each game in the season, we prepare the simulation.
For each game in the simulation, we only care about the projected winning % for the home team. Take a game between a home team and an away team. The process laid out above gives us a winning % for each team. We replace the away team’s projected probability with a random % between 0 and 1. If the home team’s projected winning % is higher than the random number, they “win” the game (they “lose” if it is lower). This is done for each game in the season and then repeated tens of thousands of times. Once the simulation is complete, we check how many times each team won a game, sum the total games won, and arrive at each team’s projected point total.
The first step is generating multiple player-level models, which produce ratings for all players in the league. For skaters, we found our xSPAR metric (Expected Standing Points Above Replacement) as well as a custom “game score” model (built using Box Score metrics) works best for predicting future team game outcomes. Our SPAR and RAPM metrics were also tested but they did not perform quite as well for this specific task. The “game score” model we are using is similar to Dom Luszczyszyn’s Game Score model; however, we tested various box score metrics and weighted them through a “grid search” approach to optimize predicting future team game win probability. For the simulation, we set the schedule for all teams, add in the projected game probabilities, and then run the simulation.
We still use a roster-level system, project various metrics for every player for next season (notably xSPAR and our own “game score” metric), determine the roster for every team (based on CapFriendly’s depth charts and research for injured players), aggregate those individual projections into team ratings for forwards / defensemen / goalies, and compute game probabilities for every game in the ’22-23 schedule. We then run a Monte Carlo simulation 50,000 times with all of that in place to project point totals for all teams in the league. As the season progresses, this simulation is re-run with updated data.
Team Point Projections
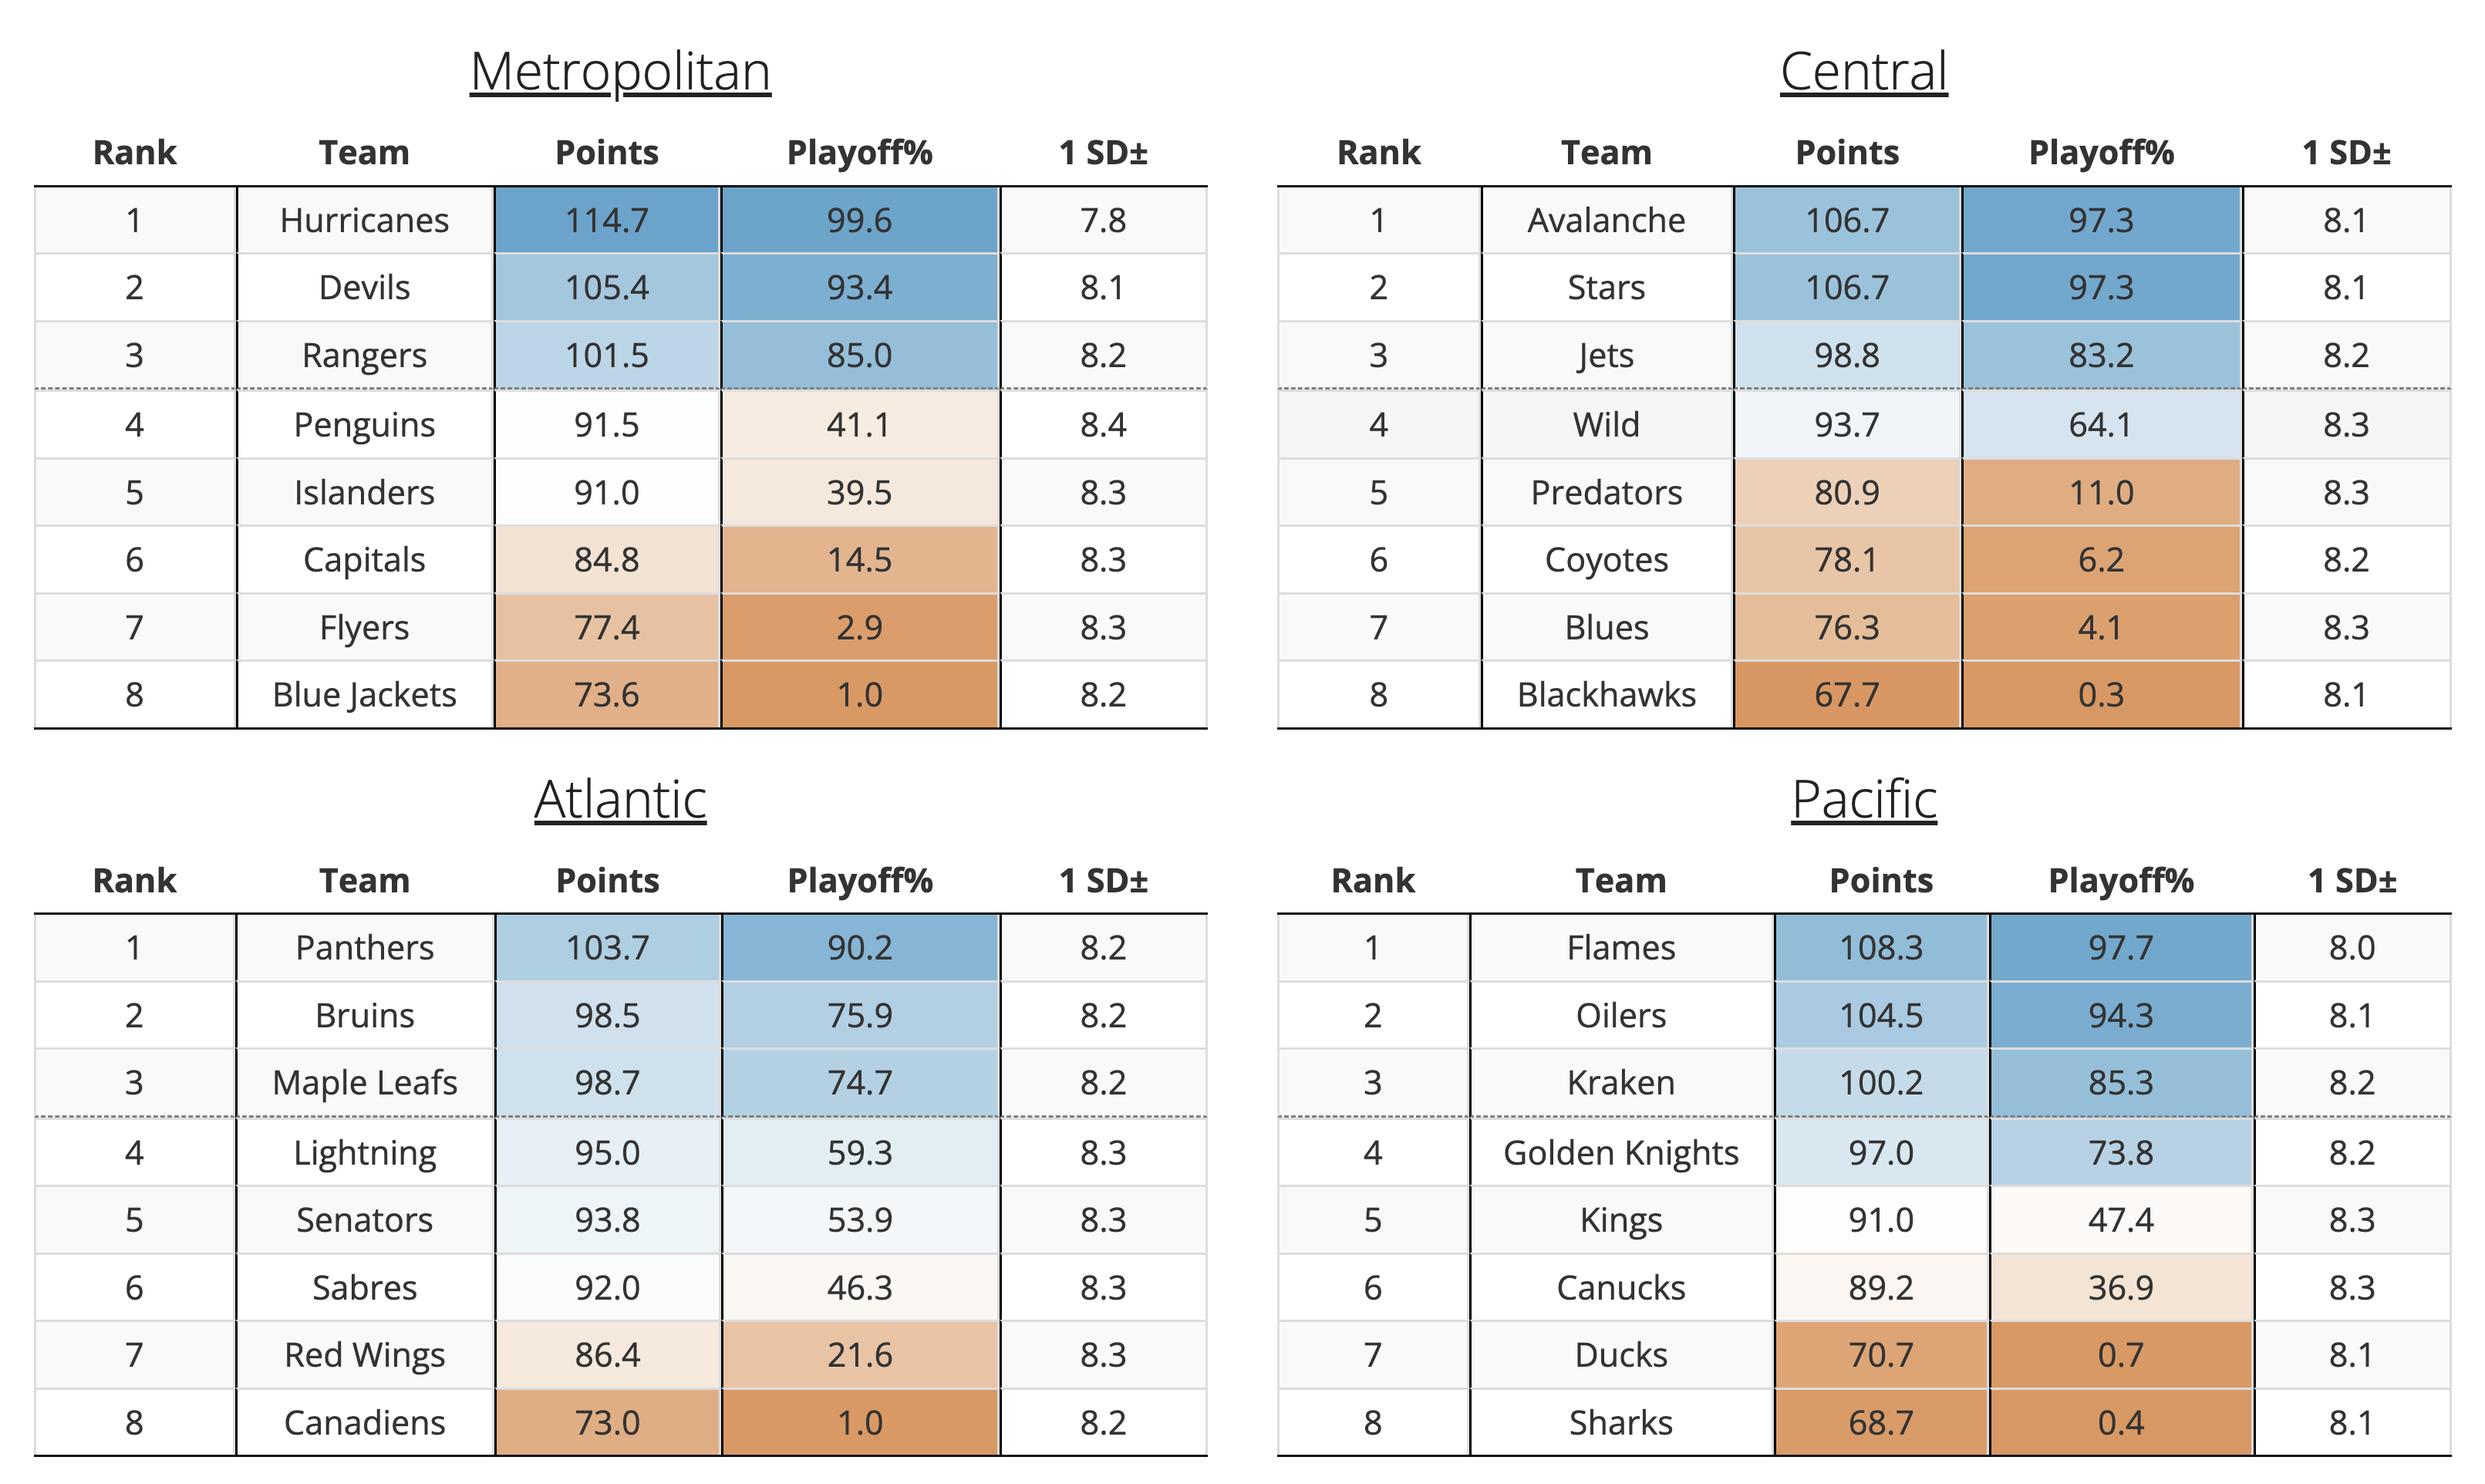
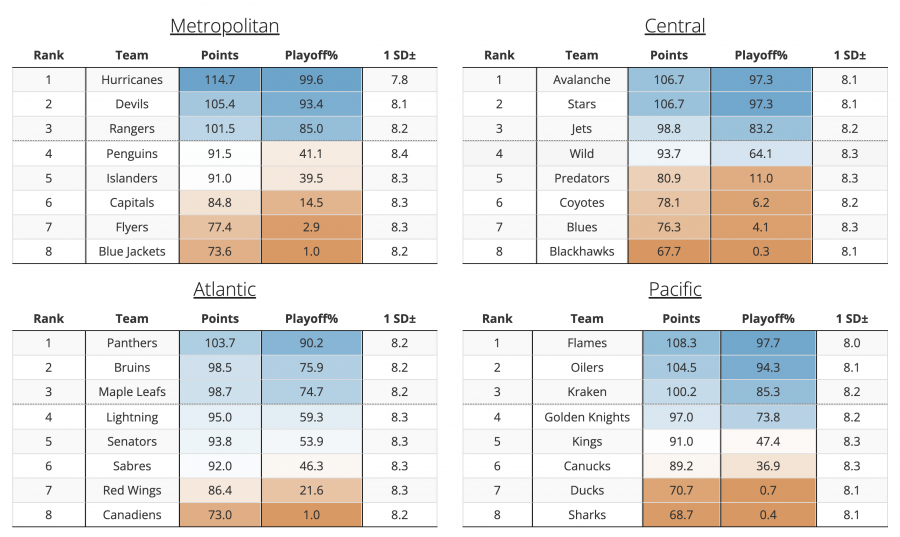
This chart (which will be updated daily throughout the season, found here) shows our preseason point projections for each team. Base rosters come from Capfriendly’s roster projections as of today. Long-term injuries have been accounted for to the best of our ability based on additional research from various team/beat sources. A note here: compared to previous years, the number of injured high-leverage players is significantly down compared to previous seasons.
Let’s take a quick look at the median points for each division:
- Metropolitan: 91.3
- Atlantic: 94.5
- Central: 87.3
- Pacific: 94.0
Not much has changed here. One thing to note, which I’ll discuss in more detail below, is the difference between the best and worst teams in each division: the gap has closed. A common trend in our projections this season compared to last is the continued return of “parity” in the league (again, still not sure exactly what this word means). Several of the NHL’s best teams last year have dropped, and the same number have “improved” by our projections.
Metropolitan Division
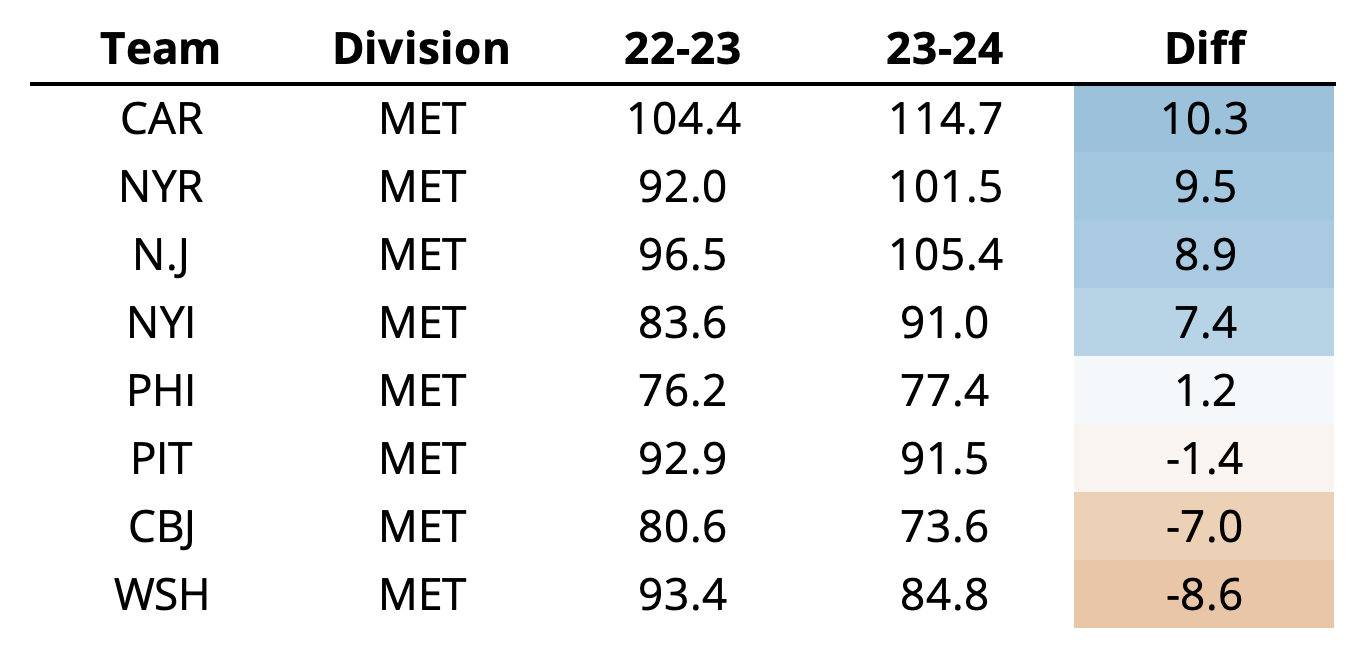
The East continues to be the strongest conference, and the Metro may just be the most improved. The best teams last year all got better, and at least one of their weakest teams (Columbus) and a previous powerhouse (Washington) are now markedly worse. With the additions of Orlov and Bunting and re-signings of a few core players, namely Fast and Andersen, the Hurricanes grade out as the best team in the league heading into the ’23-24 season. It’s no wonder really: no player on their starting roster is projected to be below replacement next season by our GAR projections, which is quite the feat by itself. Carolina may be relying heavily on an aging goalie tandem, but no team in the league is as deep or as well-rounded.
The Devils, like the Hurricanes, had a very productive offseason after a fantastic ’22-23 campaign. Locking up Bratt and Meier long-term and securing depth with Bastian and Haula goes a long way here, but the Devils continue to improve throughout their roster, which is what we like to see. We’ve been high on them for years and nothing is stopping that here. The Rangers, on the other hand, may have surprised me the most of any team (probably because I didn’t realize we were that low on them last season – I’m sure Rangers fans remember). Fox and Shesterkin go a long way here, but their (aging) veteran core is still quite good, and their younger depth players (Miller, Chytil, and Lafrenière) round out a solid roster. On the other end, the Capitals have a plan, and it seems to revolve around getting Ovechkin 73 goals this season because they literally did nothing. And they’re old. Our projections don’t like it when you’re old.
Atlantic Division
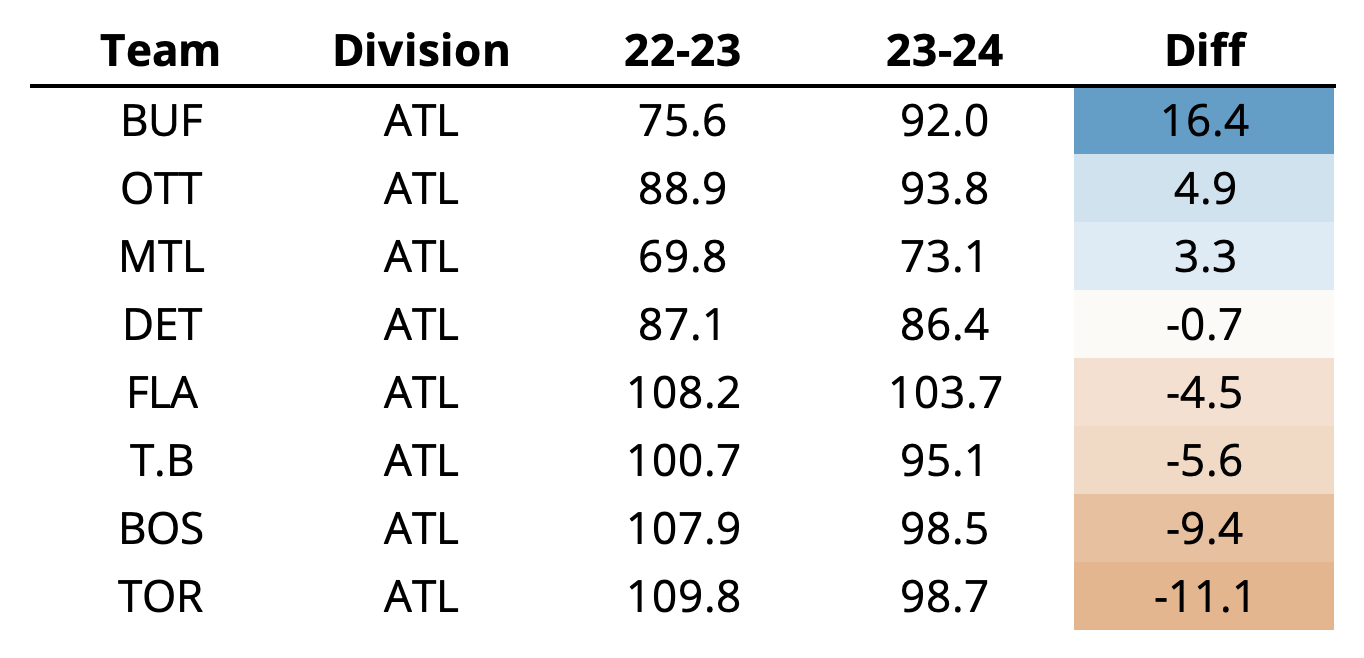
Let’s go The Buffalo Sabres. I know a lot of you may be questioning whether we’re actually Wild Fans anymore. And the answer is probably something like “yes, but are you aware of the Sabres?”. Sure, there are better teams in the league, and sure we’d like them to be higher, but only Dallas improved more in our projections compared to last season. The Sabres have one of the youngest, most promising teams in the league (Dahlin, Power, Tage, Cozens, Quinn, Levi…), and with that they bring uncertainty. A projected 92 points is one more than they finished with in the ’22-23 season, and that feels about right. But they’re breaking 100 you heard it here first.
The Maple Leafs dropped the most among Eastern teams heading into this season. The main reason here is a few of their replacement offseason additions (Reaves and Jones specifically), aging and/or injured core players (Tavares, Muzzin), and a quite questionable goalie tandem. They still have a great team, but the improvements in Buffalo, Ottawa, and Montreal make the division much more competitive, which also plays its part. Boston is in a similar situation, although it’s a bit more understandable. Few players have consistently bolstered teams the way Patrice Bergeron has for as long (I can’t believe he’s gone), and they face the same improving division. The Atlantic is likely the best division in the league, however, this year it’s because the bad teams are getting better and not vice versa.
Central Division
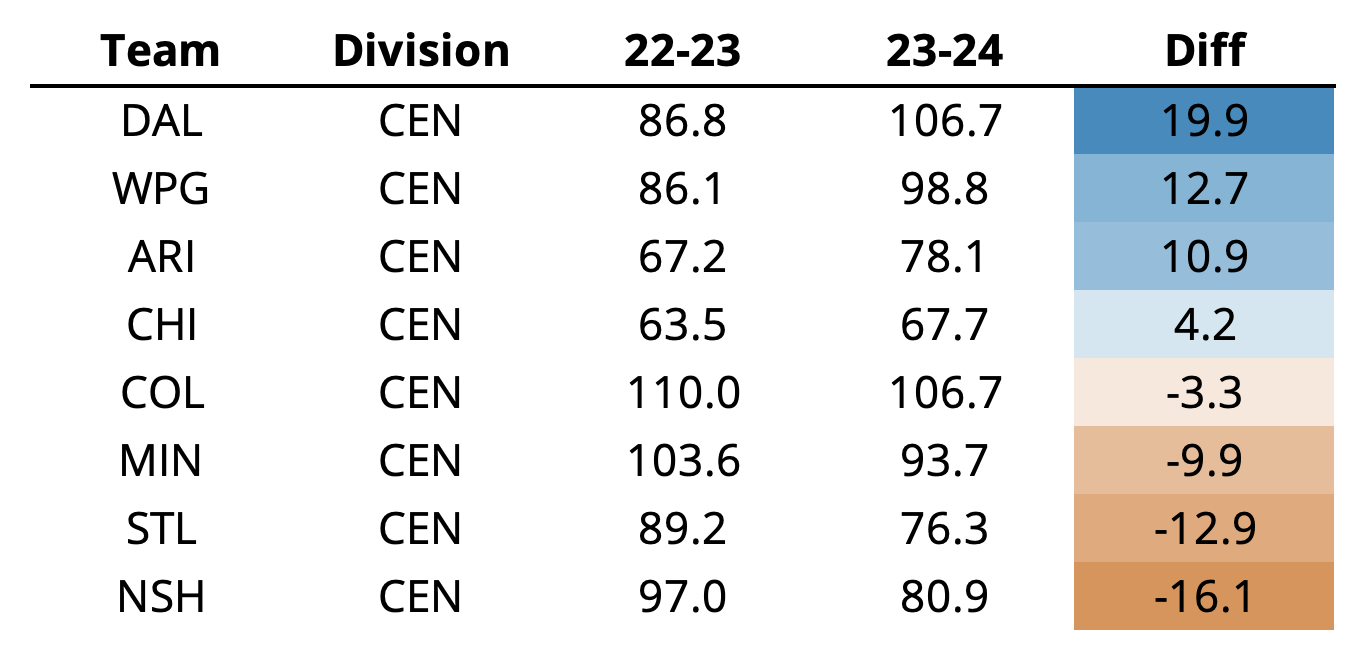
The Dallas Stars really are up there… in the sky… like a star. I don’t know, what else do you want me to say. The Stars improved the most in our projections this season, and I’m not really sure I need to explain why that is. Jason Robertson, Roope Hintz, and Miro Heiskanen are only improving, Joe Pavelski doesn’t age, their depth (Johnston, Lindell, Marchment) is stellar, and Jake Oettinger may just win the Vezina this season. Winnipeg is, oddly?, right there behind them. A big reason continues to be Hellebuyck, but their recent acquisitions may be the biggest: Vilardi, Neiderreiter, and Namestikov really fill out a lineup that still has Mark Scheifele and a new Josh Morrissey sitting at the top.
Oh, the Minnesota Wild. You didn’t do anything. Which makes sense given your roster and cap situation (although they do have ~$16M in free space heading into next summer [eyes emoji]). The Wild are content with what they have, especially after the extension of Zuccarello/Foligno, and a lot of that revolves around uncertain young talent. To be fair, it’s not the worst approach. A core of Kaprizov, Spurgeon, Boldy, and Eriksson Ek can carry any team quite a bit. The real question will be whether Gustavsson is actually that good (he is). Arizona and Chicago may have improved (the latter probably more than the model is able to account for given Bedard probably is actually that good). Regardless, the Central division is, once again, the weakest in our model.
Pacific Division
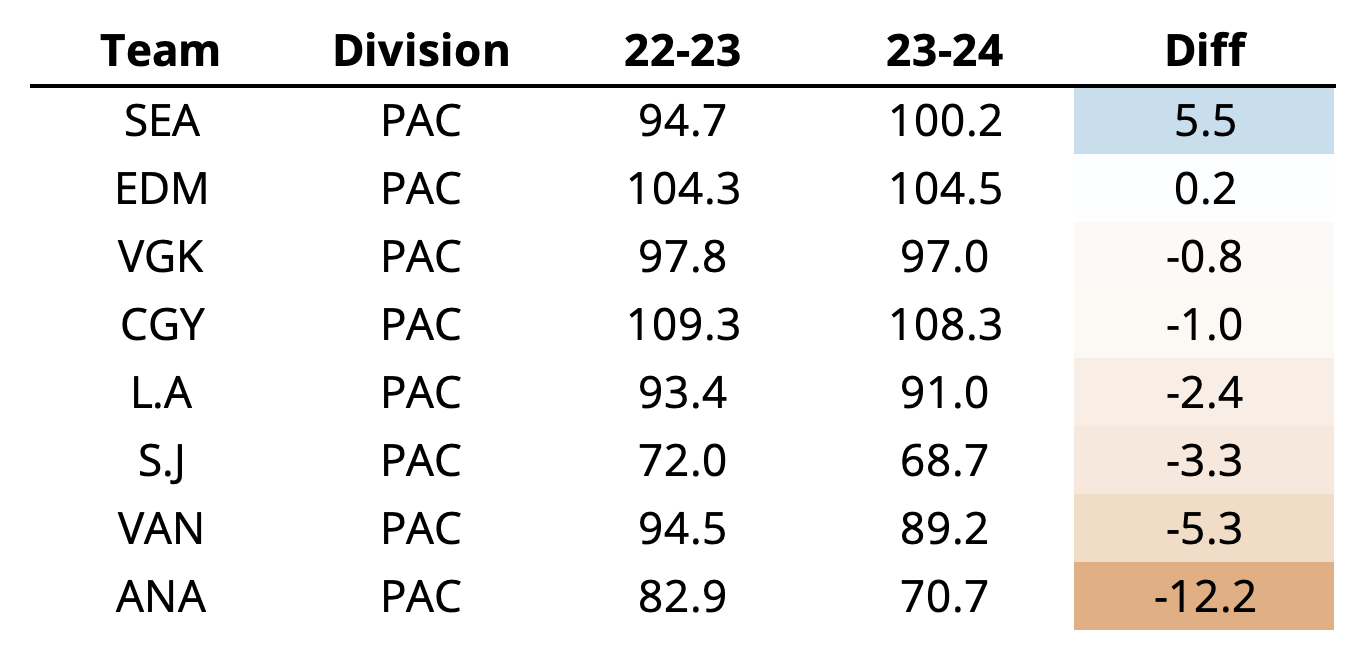
The Seattle Kraken are a force. At least that’s what our projection model thinks. To be honest, they didn’t do a whole lot this offseason, our models just really like their players. Few teams have the consistent depth of the Kraken with few high-minute bad players. McCann, Bjorkstrand, Burakovsky, Gourde, Eberle, Dunn.. I mean these are all guys we’ve liked for ages. It was meant to be. The Flames, on the other hand, may actually be more surprising here. Even after an extremely disappointing season last year, the model doesn’t know they have a new coach/system, and they’ve replaced a good number of players we projected to be their worst next season (Lucic, Stecher, MacKey, Ritchie). I believe in Jonathan Huberdeau, he has to be better than last year (he’s on my fantasy team this season).
The rest of the Pacific isn’t all that surprising. Anaheim was horrible last year, so yeah. Vancouver is Vancouver. Edmonton has the same team (they didn’t do anything), which includes McDavid and Draisaitl (they do do something). The Golden Knights may surprise some, on the heels of a recent Stanley Cup, but they’re still running out a fairly uncertain (from the model’s perspective) team with a lot of up and down players. Despite all of these “expected” results, at least for us, the Pacific is an extremely strong division. If Seattle and Calgary perform the way we’re projecting here, it may just be the most interesting.
Wrapping Up
As we noted in our free agency review a little over a month ago, the looming salary cap increase has injected chaos into the NHL environment. Few teams actively tried to “improve” with their free agency acquisitions this past summer and even fewer tried to get worse. This, at least in my mind, places a strong focus on depth and team-controlled young players. Teams like Buffalo, Seattle, and Winnipeg are using this as an asset while Toronto, Pittsburgh, and Washington are attempting to overcome it with their veterans.
The obvious, easy story heading into the season is Connor Bedard’s rookie campaign, but it’ll be a few years before the Blackhawks have a chance. The real story, at least in my opinion, will be Bedard plus the rest of his young peers. A changing of the guard has been occurring for a bit now; numerous veteran stalwarts have aged out of the league or are in the process of doing so and even more future stars are entering the league or entering their prime. I mean for God’s sake, Sidney Crosby is 36 years old, Patrice Bergeron just retired, and Connor McDavid hasn’t won a Cup yet. This all sets up next year’s summer, which is shaping up to be quite an event given the number of premium players up for contracts. Even with some recent extensions the summer of 2024 is shaping up to be quite fun. In the meantime, let’s enjoy a new NHL season that may be the most competitive we’ve had in a while.
How do you determine how rookies or players with less than three years of play work in the model?
Unfortunately, we do not have prospect data, so rookies are projected based on their draft position, age, and position. We make separate models to predict players who have only played 1 or 2 seasons in the NHL. So, in total, there are 8 models for skaters (2 different skater metrics x 3 different models depending on 1, 2, or 3 prior seasons… plus 2 more models to project skaters with no NHL time). Goalies are treated the same for the respective predicted metrics.
How are loser points accounted for in the simulation? You mention if the home teams projected winning % is higher than the random number then they win which is pretty straight forward as they get 2 points out of it but how do you determine which losses are in overtime/the shootout?
Loser points are a rather odd thing in the NHL – we’ve tried to predict the likelihood of a game ending in overtime, and it is almost random from what we can tell. Because of this, for each “simulated season” we set ~22.5% of the games as having gone to overtime (this is close to the historical rate of games that go to overtime). For the games marked “overtime games” we give the losing team an extra point. It’s maybe not the best method, I guess, but it brings the projected point totals for the league up to about what we’d expect. Also, these random loser points are different for each of the 20,000 “simulated seasons” so it basically averages out across all teams.