It’s that time of year, once again. The NHL playoffs have begun, and, for the first time in two seasons, we have a full 82 game season behind us. We enjoyed doing this coverage last season, so we’ve more or less kept the same format. The model is more or less the same (save new data, teams, rosters, etc.). The “we” here is your Evolving Hockey Staff (Josh Younggren, Luke Younggren, and Shawn Ferris). Just like last year, we split up duties. Josh and Shawn wrote up the previews, and Luke compiled the data, ran the models, and generated the images. Let’s hear it for Luke!
Round 1 of the ’21-22 NHL playoffs is shaping up to be one of the more interesting rounds we’ve had in several years. That’s maybe not too surprising given the first round is often the most interesting – upsets, blowouts, the Leafs losing. And while we do project several very lopsided series, the road for several great teams (specifically in the East) looks daunting to say the least. The top-5 teams in the playoffs this season feel unreasonbly good compared to the age of parity we’ve seen for the better part of the last 10 years, but they’re all going to have to play each other. Except for the Avalanche and Flames.
As we noted last year, the NHL playoffs are hard to predict. Sure we’ve spent many many hours getting all of this ready, and we trust our modeling process, but the playoffs aren’t fun if things go exactly as planned. As we said last year: “Trying to project who will win in the NHL playoffs is mostly a fool’s errand. But that’s what makes it fun. The regular season, the President’s Trophy, and maybe a few of the best players in the league are the things we can almost kind of predict. The playoffs are pure chaos and entertainment. However, we here at EH like to enjoy the absurdity of it all and just watch for fun. (Of course we’ll still be cheering for our predicted winners). Let’s get into it.”
Model Info
Our playoff probabilities are generated in a three step process. We use multiple models to project “future” values for all players, use these player projections to build a game probability model that projects the winning % of any given team matchup (logistic regression), and then feed these individual game probabilities into a Monte Carlo simulation that generates the probabilities for each series. In order to complete this process, each team’s player projections are aggregated into F/D/G groups, and various metrics are used for each group which are then fed into the game probability model. With these inputs, we are able to generate home and away team winning percentage values. Once we have projected all home/away probabilities for the playoff games, we prepare the simulation.
For the simulation, in a given game, we only care about the projected winning % for the home team. Take FLA/WSH. The process laid out above gives us a winning % for each team. In game 1, FLA is the home team. We replace WSH’s projected probability with a random % between 0 and 1 since they are the away team. If FLA’s projected winning % is higher than the random number, FLA “wins” that game (they “lose” if it is lower). In game 3 when WSH is the home team, we do the same for FLA (we replace their winning % with a randomly generated %). This is done for each team game in all series and then repeated 50,000 times. Once the simulation is complete, we check how many times each team won a game, sum the total games won in a series, and arrive at each team’s projected probability.
The first step is generating multiple player-level models which produce ratings for all players in the league. For skaters, we found our xSPAR metric (Expected Standing Points Above Replacement) as well as a custom “game score” model (built using Box Score metrics) worked best for predicting future team game outcomes. Our SPAR and RAPM metrics were also tested but they did not perform quite as well for this specific task. The “game score” model we are using is similar to Dom Luszczyszyn’s Game Score model; however, we tested various box score metrics and weighted them through a “grid search” approach to optimize predicting future team game win probability.
Atlantic Division
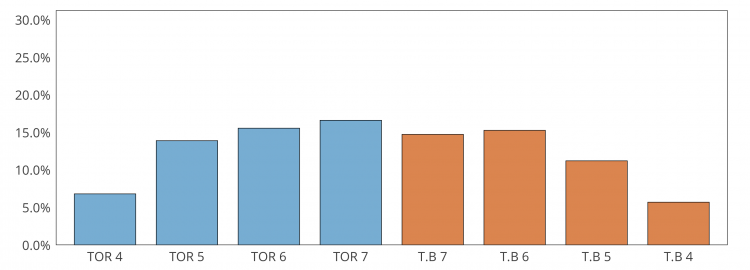
Florida Panthers (1) vs. Washington Capitals (4)
83.7% 16.3%
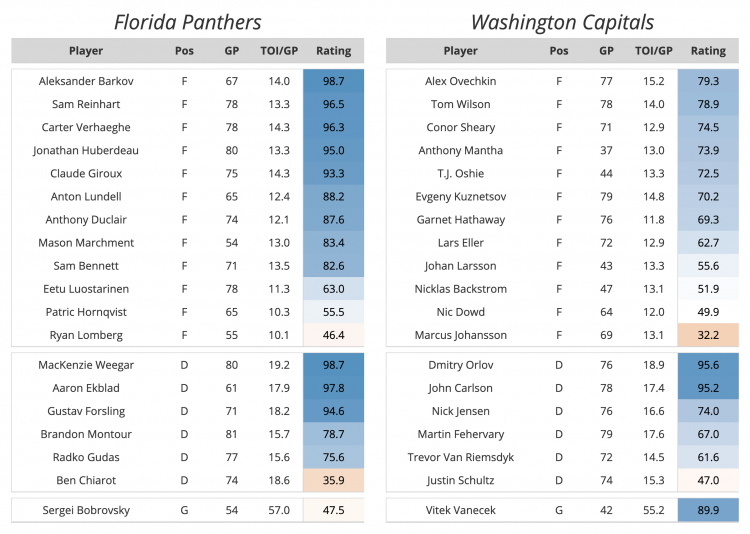
The President’s Trophy winners are the highest-scoring team in the Evolving Hockey database which goes back to the 2007-08 season. They scored 337 goals (not including shootout goals), 18 more than the 2018-19 Tampa Bay Lightning. A lot of focus is on Jonathan Huberdeau and his point production, but Mason Marchment might be the real MVP. He led the Cats in GAR (20.5) in just 54 games. Florida had a chokehold on the game when he was on the ice, obliterating opponents. His only flaw was that he took a few too many penalties. Alongside him was offseason acquisition Sam Reinhart who finished 2nd on the team in GAR. Freed from Buffalo, he’ll be ready to fight for a Stanley Cup alongside the only player picked ahead of him in the 2014 NHL Entry Draft. This team is deep and deadly.
FLA Strengths: Scoring goals
FLA Weaknesses: Defense but that’s optional
The Washington Capitals are a team that is…well they are a hockey team for sure. They sit middle of the pack in terms of controlling play at 5v5, and get a slight boost due to average goaltending and good shooting. Dmitry Orlov and Nick Jensen proved to be an excellent “second pairing” with an xGF% of 54.3%. However, they’ll have their hands full with whoever they get matched up against on the Panthers. Unlike in years past, the Capitals didn’t have a dominant powerplay this season. While Ovechkin may still spend a whole two minutes out there, the Capitals only scored 7.01 goals per 60 minutes at 5v4 this season which ranked 17th. They also gave up shorthanded goals against at a high rate, which doesn’t match up well against the Panthers penalty kill which finished 3rd in 4v5 tallies per 60 minutes.
WSH Strengths: Even strength finishing ability
WSH Weaknesses: Powerplay
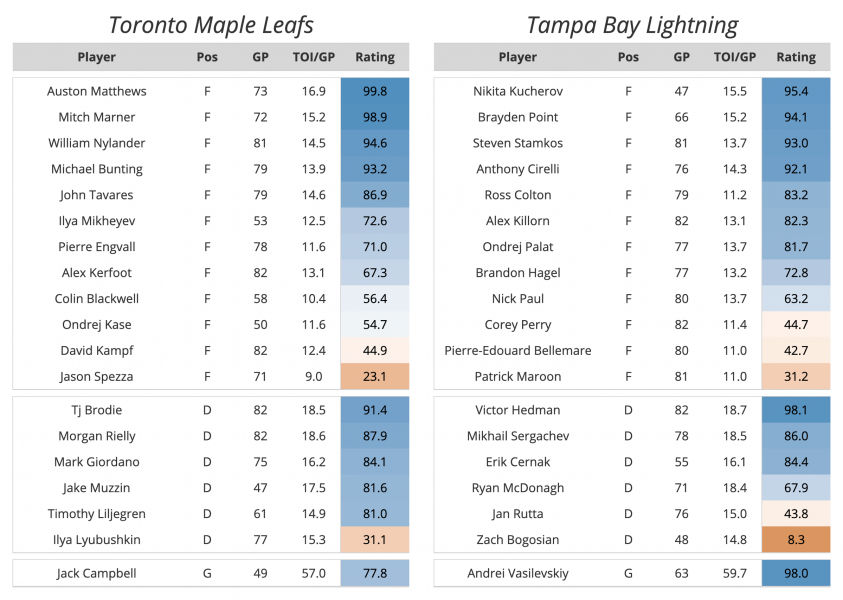
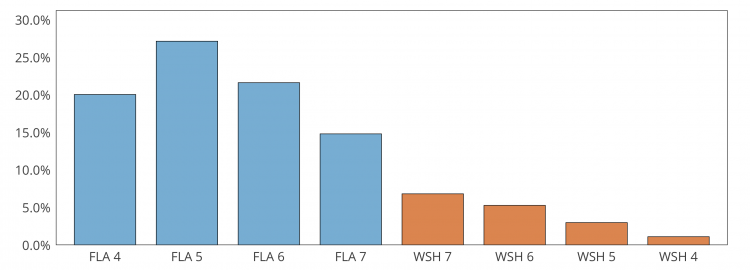
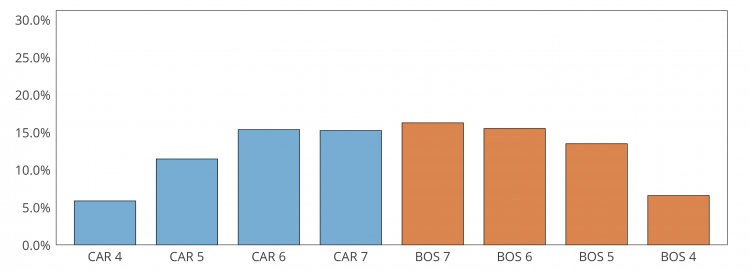
Toronto Maple Leafs (2) vs. Tampa Bay Lightning (3)
53.0% 47.0%
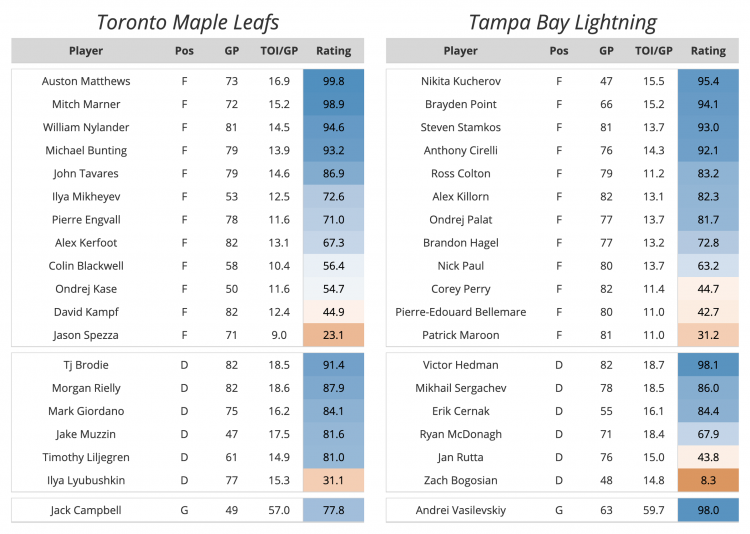
The Maple Leafs are one of the most electric teams in the National Hockey League. Led by the core four of Auston Matthews, Mitchell Marner, William Nylander, and John Tavares, only the Florida Panthers scored goals at a higher rate (all situations). As Rodney Atkins once said, “If you’re going through hell, keep on moving.” That’s exactly what they did this spring. Despite a horrible 88.4% save percentage between January and March, the boys in blue were able to outscore their problems – probably leaving Ken Holland in complete confusion. While the focus will rightfully be on the Leafs stars, it would be wrong to ignore the middle-of-the-lineup pieces that will be key to finally breaking through the first round. Specifically, Ilya Mikheyev who has recorded 21 goals in 53 games this season. His speed and awareness helps him control play and creates an offensive threat while shorthanded. Don’t be surprised if he gets a breakaway or two. Leafs fans will just hope that it doesn’t end up like Kasperi Kapanen in the bubble.
TOR Strengths: Putting the puck in the opponent’s net
TOR Weaknesses: Goaltending
The Lightning tried their best to sneak into the Metro bracket at the end of the season. As the weather got warmer, the Lightning hit a bit of a cold streak and find themselves third in the Atlantic Division searching for their third Stanley Cup in a row. After facing him in the Stanley Cup last summer, the Lightning went out and acquired Corey Perry in free agency. He, along with Patrick Maroon and Pierre-Edouard Bellemare, has created a dominant fourth line for the Lightning. In the 586 minutes that the trio has been on the ice at 5v5 this season, the Lightning have a 57.3% share of expected goals with an actual goal differential of 25 to 9. That rigid line will help Jon Cooper, especially on the road. Victor Hedman and Steven Stamkos have also had phenomenal seasons, leading Tampa in xGAR and GAR. Tampa’s stars have shown up in the postseason after their early exit in 2019. One would probably expect more of the same this season.
TB Strengths: Cap management
TB Weaknesses: No one wants them to win again
Metropolitan Division
Carolina Hurricanes (1) vs. Boston Bruins (4)
48.0% 52.0%
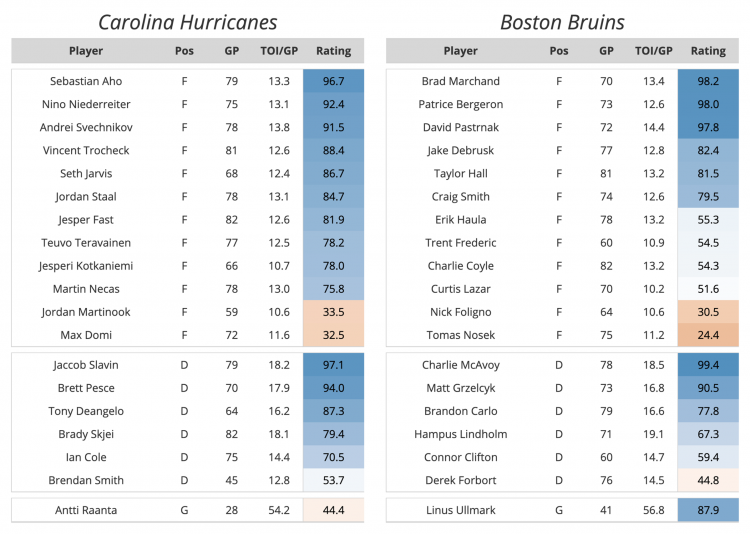
Just like last weekend in Emilia Romagna, it was a rough time for an Italian car manufacturer against their Japanese opponents. In three games this season, the Hurricanes outscored the Bruins 16-1, taking all three games. While the Prius might’ve taken the regular season matchups in dominant fashion, the model still favors the Lamborghini. Patrice Bergeron is still causing headaches for his opponents, but he has a new linemate in Jake Debrusk. With the promotion of the Edmonton-native, David Pastrnak has spent his time to the right of Taylor Hall and Erik Haula. While there was speculation that the Bruins may try to add a center at the deadline in March, they opted to bring in Hampus Lindholm from Anaheim instead. The steady Swede has pushed Matt Grzelcyk down to aid Brandon Carlo with his breakouts. This has the feel of the same Bruins team we’ve been seeing in the playoffs over and over again.
BOS Strengths: Dominant top half of the lineup
BOS Weaknesses: Depth, inexperienced goaltending
After a couple of rough seasons in Toronto, Frederik Andersen went down to Raleigh, North Carolina to search for revival. And that he found. Andersen finished 3rd among goalies in GAR – a season that may have competed for Vezina if it weren’t for Igor Shesterkin’s incredible season in New York. However, he might not face his demons against Boston once again. A late-season injury will keep Andersen out for the start of the series at least, which tilts the odds in Boston’s favor. Interestingly, not a single Carolina Hurricane had a negative goal differential at 5v5, and Martin Necas was the only skater with a very slight negative expected goal differential. Perhaps due to the fact they don’t have any true anchors on their team, they seem to play to a result that is greater than the sum of their parts. They’ll hope that continues in this series.
CAR Strengths: Controlling play
CAR Weaknesses: Lack of star power
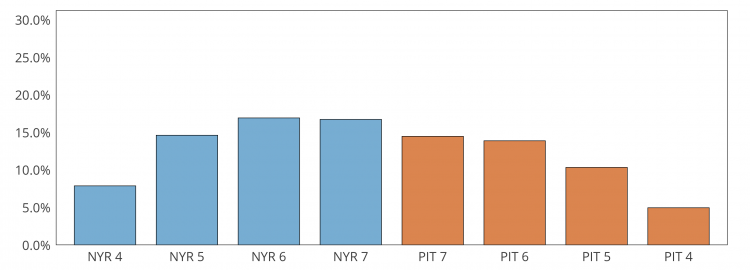
New York Rangers (2) vs. Pittsburgh Penguins (3)
56.3% 43.7%
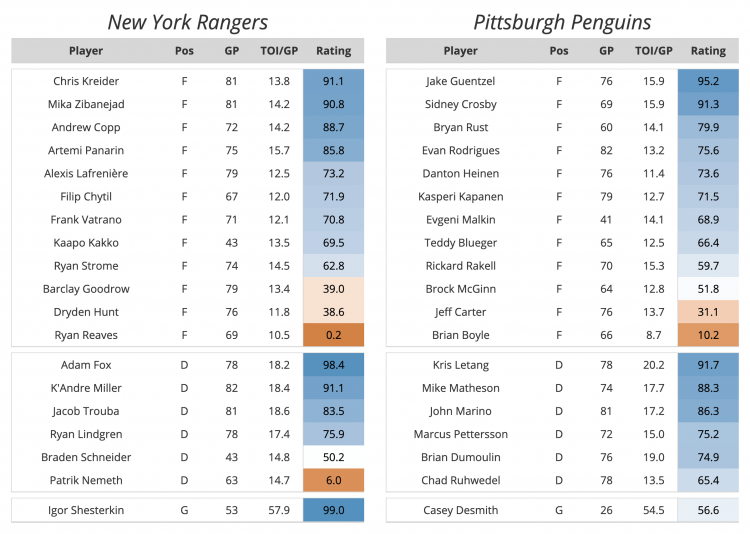
The Pittsburgh Penguins. If ever a team was eternally summarized in one thought, Mark Donk and Buzz Flibbet is it. Of course they still have Sidney Crosby, Kris Letang, and Evgeni Malkin, but few teams have relied on under-covered players quite like the Penguins have. In ’21-22, Mike Matheson and Chad Ruhwedel were 1 and 2 in overall xGAR for the team, and while the aforementioned talent sits towards the top, Evan Rodrigues, Danton Heinen, Teddy Blueger, and Marcus Pettersson have provided quite solid depth for the Penguins overall. However, like their opponent, the Penguin’s MVP this season has been Tristan Jarry. While he cooled off towards the end of the season, his 28.3 GAR ranks 7th among goalies in the playoffs (and 10th among all goaltenders this season). Unfortunately, it appears Jarry will be out for 1-2 games, leading us to slot Casey DeSmith in as the Penguins starter. Regardless, the test for Pittsburgh will be whether they can provide a consistent defensive performance in front of their goalie.
PIT strengths: goaltending, Donk and Flibbet
PIT weaknesses: Inconsistent defense, age
No team has relied as heavily on goaltending this season as the New York Rangers have. An argument could be made that no team in the modern era has. Igor Shesterkin’s 50.4 GAR is the highest number a goaltender has put up since 2007. Why does this feel so familiar? Hmm, I can’t quite put my finger on it. While Shesterkin’s season is well known, the Rangers do have some very good high-end skater talent in Chris Kreider, Mika Zibanejad, and Panarin at forward and Adam Fox and K’Andre Miller on the backend. A potential issue for the Ranges is their overall depth. At even-strength they have the lowest CF/60 and xGF/60 RAPM differentials of any team in the playoffs. While they have played much better in the last month, their easy schedule during this time casts doubt on this improvement. Goaltending is incredibly important in the playoffs, and the Rangers have one of the best goalies in the league, but if the vast majority of your success relies on goaltending, things can get sketchy real quick.
NYR strengths: Shesterkin, Fox
NYR weaknesses: skater depth, relying on goalie
Central Division
Colorado Avalanche (1) vs. Nashville Predators (4)
88.4% 11.6%
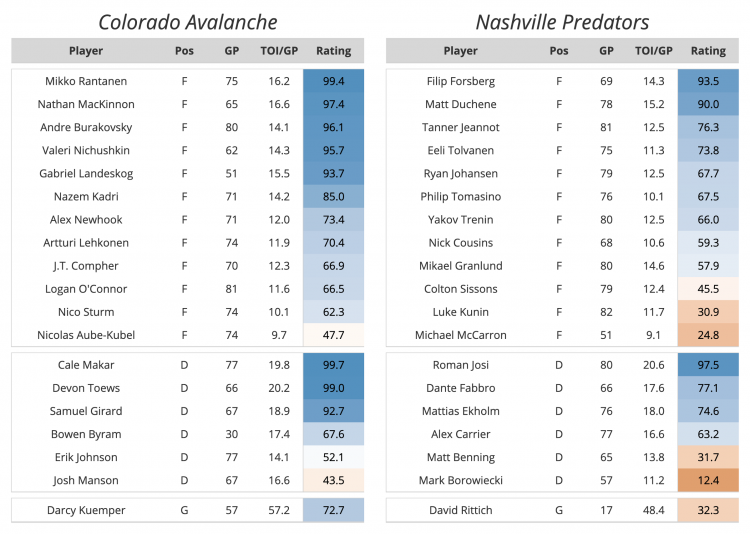
The Predators may be the most average team in the NHL. In ’21-22, they posted 0 xGF/60 and -0.02 CF/60 RAPM differentials (both 16th in the league), while putting up a 0.16 GF/60 differential (13th). Among skaters, Roman Josi and Filip Forsberg have been absolutely outstanding this season, and Matt Duchene and Ryan Johansen’s resurgent seasons have contributed to the Preds playoff berth. The real star for Nashville, however, has been Juuse Saros. His 32 GAR ranked 4th among all goaltenders this year. Unfortunately, it appears Saros will miss at least the first round of the playoffs. While David Rittich posted several decent seasons with Calgary, his performance recently has not inspired joy. It doesn’t help that the Predators have one of the toughest opponents in the playoffs.
NSH strengths: Stars, potential goaltending
NSH weaknesses: bad luck, uninspiring depth
The Colorado Avalanche are starting to feel like the Tampa Bay Lightning given how heavily favored they’ve been in our model over the years. Their 88% probability is the highest for any team in the first round, and while some of that has to do with their opponent, the Avalanche are just really good. It’s getting a little cliché at this point, but the Avalanche’s skater talent is comical. Not only do they have one of the strongest forward groups in the league, Makar, Toews, and Girard are top-pairing D on every team. The wealth of talent on Colorado makes them incredibly daunting opponents and possibly the best team heading into the playoffs (again). Coming out of the West makes it even easier for them. Their one weakness, if I have to find one, may be some of their low-TOI players (Erik Johnson, Josh Manson, potentially MacDermid and Jack Johnson), but it appears the Avs will not be relying on these players heavily once the playoffs start.
COL strengths: everything everywhere all at once
COL weaknesses: none
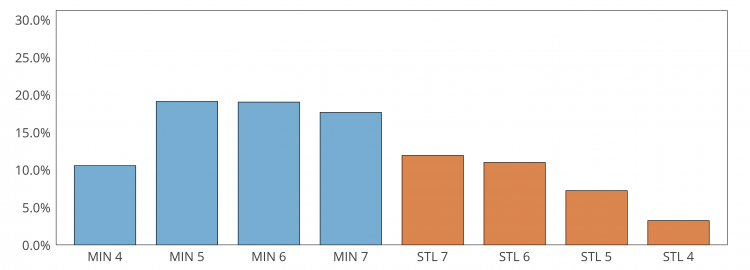
Minnesota Wild (2) vs. St. Louis Blues (3)
66.5% 33.5%
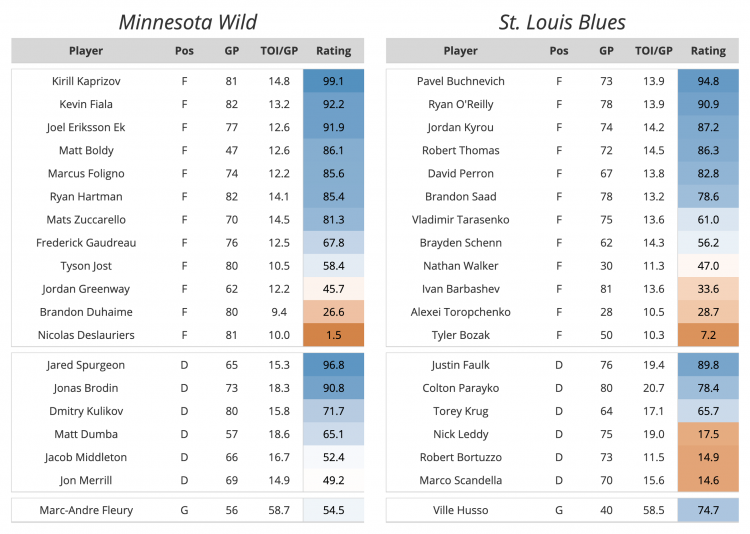
This series may prove to be one of if not the most entertaining series in the first round. The Blues are underdogs in this series, which was not helped by the Wild clinching home ice in their last game of the season. However, they’re entering the playoffs on a hot streak having won 12 of their last 15 games. While Evolving Hockey readers and users may know this, the Blues’ MVP this season has been Pavel Buchnevich, who leads the team in GAR and xGAR, along with the 16th best EV xGF/60 RAPM differential in the league. Along with the consistently good Ryan O’Reilly, a bounce back year from Tarasenko (albeit a bit overblown), and strong seasons from Jordan Kyrou and Robert Thomas, the Blues’ top 6 are easily their biggest strength. However, a point of concern is their depth after that. In net, Ville Husso has been sensational in the 40 games he’s played. Jordan Binnington, on the other hand, has not. While it’s unclear how St. Louis will approach their goaltending, Husso could surprise during the first round. I’m getting scared thinking about the Wild facing another hot St. Louis goaltender.
STL strengths: top-6, Husso
STL weaknesses: below-average EV team metrics, depth
This is not the same Minnesota Wild team Luke and I grew up with, however, on paper their team metrics feel like they might be? Kirill Kaprizov has developed into a full-fledged star, unlike any forward that’s ever played for the team. In our player models, Kaprizov is 5th in terms of overall impact among all players. Impressive stuff. Like St. Louis, the Wild’s top-6 and defensive group is their strength. With the addition of Matt Boldy to the roster mid-season Kevin Fiala found a new level, which gives the Wild two very potent scoring groups at EV. Their weakness, also like the Blues in a way, is their bottom line and pair. The Wild made moves at the deadline to get “tougher”, but a few of these moves and a bigger focus on physicality may just backfire if they aren’t careful. The real question mark, at least by the numbers, will be goaltending. While Fleury he has had his moments, his play with the Wild this season has been below average at best (-1.28 GSAx in 11 games). Talbot hasn’t been much better all things considered. Minnesota will likely rotate their netminders, but the duo is one of the weakest among playoff teams.
MIN strengths: top 2 F lines, Spurgeon
MIN weaknesses: goaltending, physical instead of good
Pacific Division
Calgary Flames (1) vs. Dallas Stars (4)
86.9% 13.1%
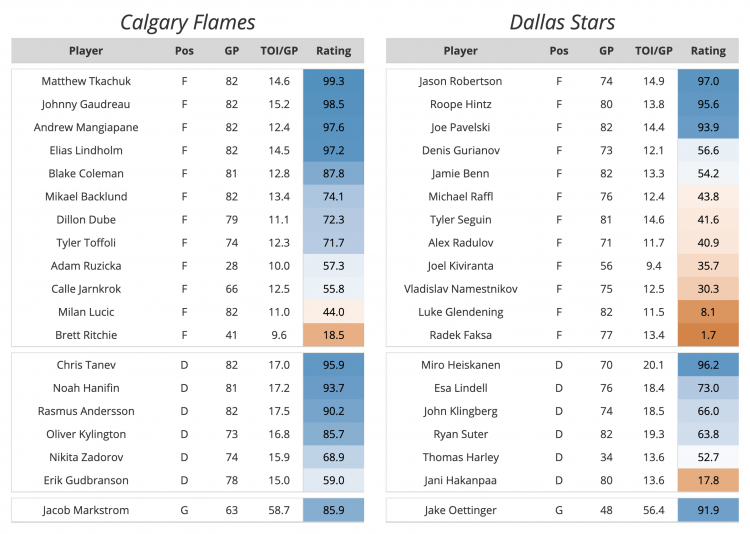
The Stars ended their season in interesting fashion, taking the first Wild Card spot from Nashville in their last game against an emergency backup goalie. It’s been a weird year for the Stars. They’re the only team in the playoffs with a negative goal differential (-8) due to their 23 one-goal wins (save shootouts, which ups that number to 26). But at their heart, the Stars are a one-line team through and through. Robertson, Hintz, and Pavelski have completely carried this team to the 2nd wild card in the West. I suppose this unfairly overlooks Miro Heiskanen (along with solid seasons from Esa Lindell and John Klingberg), but that’s essentially the whole team. Our models really like Jake Oettinger in goal, and while he has been very good in the 48 games he’s played (15th among all goalies in GAR this season), there is a slight bump here in his projection due to his young age. Only the Blues and Rangers have a lower CF/60 RAPM differential at even strength, and outside of the top line and top-D pair, the Stars don’t have much going for them. Especially against their opponent.
DAL strengths: Robertson, Hintz, Pavelski, Heiskanen
DAL weaknesses: everything else
The Flames enter round 1 of the ’21-22 NHL playoffs with the second-highest probability (just behind the Avalanche). And for good reason: this team is stupid good. Their first line of Johnny Gaudreau, Elias Lindholm, and Matthew Tkachuk may well be the best line in hockey. +/- records aside, they are top-3 in basically every category of line combinations. Calgary’s top-4 D also challenges any team in terms of their overall value, and the rest of their forwards are rock solid. Only the Hurricanes and Panthers have a higher CF/60 RAPM differential at even-strength, and Jacob Markstrom finished the season with the 5th highest GSAx among all goaltenders (only behind Shesterkin, Andersen, and Vasilevskiy of those in the playoffs). Calgary is good at everything, and they have arguably the easiest path in the bracket. They’re the team to beat.
CGY strengths: everything, playoff bracket
CGY weaknesses: NULL
Edmonton Oilers (2) vs. Los Angeles Kings (3)
72.7% 27.3%
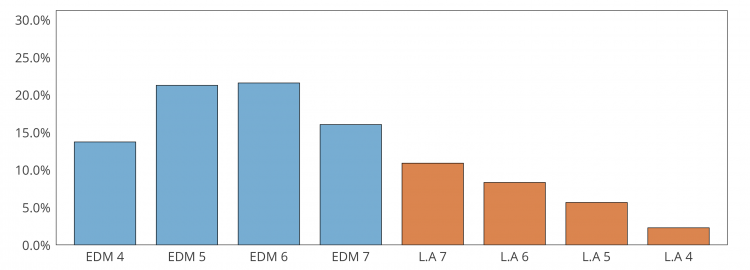
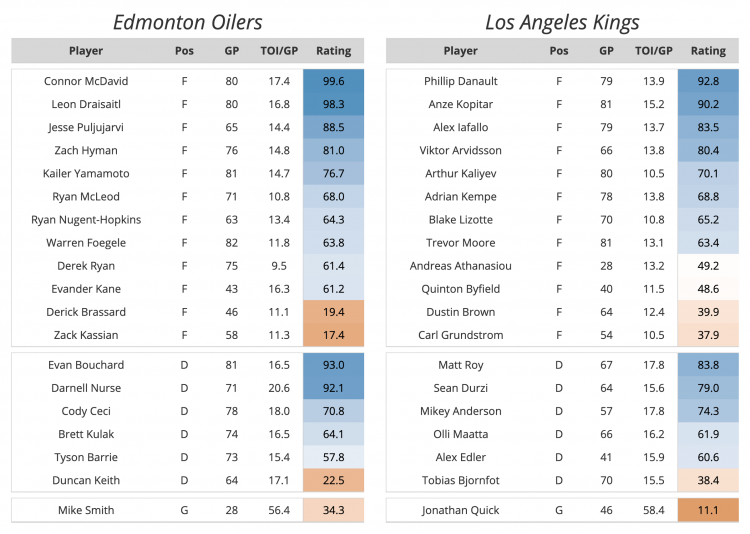
This may be the most interesting matchup in round 1. While the Oilers are favored here, the Kings are possibly the most surprising team of the season. Very much under the radar, their EV shot metrics (both shot attempts and xG RAPM) have been in top-10 all season. Anze Kopitar and Drew Doughty have been great, but the real star has been Phillip Danault who was recently signed this past offseason. This team feels like a mid-2010s sleeper pick: 7th in 5v5 CF%, 17th in 5v5 GF%, overlooked because of their Pacific time zone and recently poor seasons, this Kings team has something brewing. Jonathan Quick doesn’t look particularly great in our model here due to previous season performances and his age, but like Doughty he has bounced back this year. As noted, the Kings issue is their lack of results to match their good shot metrics. While the Kings’ shot suppression is among the best in the league, their offense hasn’t matched this defensive strength.
LA strengths: classic 2010s shot metrics
LA weaknesses: lack of gamebreaker, general scoring issues
During the McDavid era, the Oilers have been plagued by depth issues. They have two of the best players in the world (Connor McDavid and Leon Draisaitl), but after that? Rarely have there been the supporting pieces to fill out a contending team. Despite some of the curious moves the Oilers made this past offseason, this team is different than the previous iterations of McDavid’s Oilers. They finished the ’21-22 season 8th in overall CF/60 RAPM differential, which is easily their best EV season since McDavid entered the league. The difference from prior seasons is the supporting cast: Puljujarvi, Hyman, and Yamamoto have filled out the top-2 lines nicely, and Darnell Nurse and Evan Bouchard have somehow made Duncan Keith and Cody Ceci in the top-4 work. The big question mark will, quite obviously, be goaltending. Mike Smith may be 40 years old, but his play in 28 games has been quite good. But he’s 40 years old. While Mikko Koskinen struggled for portions of the season, he’s an option if Mike Smith does Mike Smith things. This is possibly the best Oilers team we’ve seen in the modern era, but their road past the first round isn’t particularly easy.
EDM strengths: star power, improved depth
EDM weaknesses: goaltending questions
Leafs in 4
Greg has The Passion
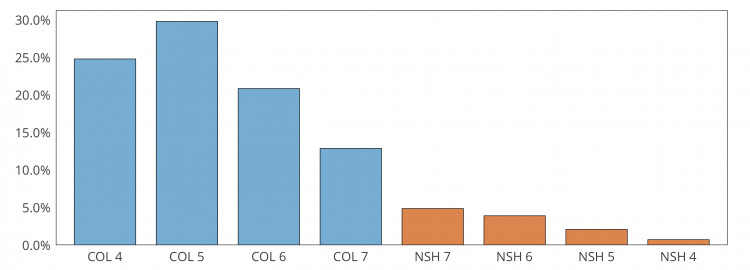
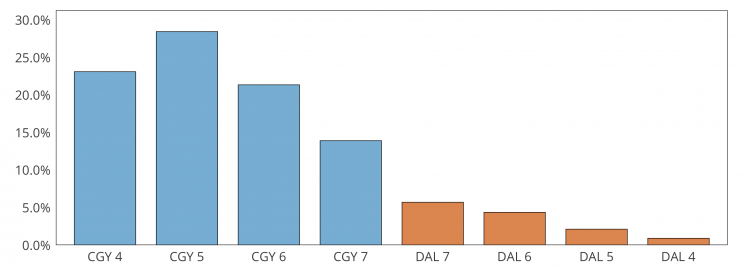
Looking at the Colorado/Nashville series, is that the most lopsided simulation you’ve had as a model for a playoff series?
Colorado vs. St. Louis in the round 1 last year was actually the highest we’ve had (90.5% for Colorado). They’re not too far off this year.
I’m surprised that Vanecek grades out so highly for the Caps here – he had a negative GSAx and was the 24th-ranked goalie by GAR. Where does that 89.9 rating come from?
It is a little surprising. The goalie model is a bit hard to dig into, but age + trajectory/past performance is a big portion of the projection. While Vanecek hasn’t been elite, he’s improved in the two seasons he’s played and is 26. We see something similar with Oettinger as well.
Also, the “rating” can be a little misleading as is the case when numbers are converted to percentiles (they remove any indication of the distribution for the population). The difference between say Shesterkin (99) and Vanecek (90) is much much bigger than Vanecek and say Kuemper (72) even. If that makes sense.